northward
asked on
Frequency Table quartile
Hi,
I have a frequency table
Column 1 is the marks and column 2 is the frequency.
Eg
1, 5
2, 5
3, 5
4, 5
I would expect Q1 to be 1.25, Q2 to be 2.5, Q3 to 3.75
Can this be done easily in excel?
I have a frequency table
Column 1 is the marks and column 2 is the frequency.
Eg
1, 5
2, 5
3, 5
4, 5
I would expect Q1 to be 1.25, Q2 to be 2.5, Q3 to 3.75
Can this be done easily in excel?
David Sankovsky
What is the mathematical equation you need to evaluate (as in, if Marks is 1 and Frequency is 5 how do you get 1.25)
Assuming your marks are in col. A and start from cell A2. (i.e. A2:A5 as per your sample data)
Assuming your frequencies are in col. B and start from cell B2 (i.e. B2:B5 as per your sample data)
Try this....
In C2
Assuming your frequencies are in col. B and start from cell B2 (i.e. B2:B5 as per your sample data)
Try this....
In C2
=SUM(B$2:B2)/COUNT(A:A)
Just wondering what if you got a different frequency for each of the entries? and what is the expected result you need.
I'm not too sure if this is what you want?
but I could be wrong...
28738047.xlsx
I'm not too sure if this is what you want?
but I could be wrong...
28738047.xlsx
sorry, I mean to be this..
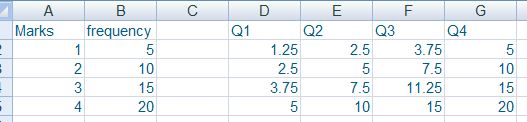
for Q1: =$B2*25%
for Q2: =$B2*50%
for Q3: =$B2*75%
for Q4: =$B2
IF it's not related to Column Marks and it's in quartile.
28738047_b.xlsx
for Q1: =$B2*25%
for Q2: =$B2*50%
for Q3: =$B2*75%
for Q4: =$B2
IF it's not related to Column Marks and it's in quartile.
28738047_b.xlsx
ASKER
Sorry ....
What I meant was
1, 5
2, 5
3, 5
4, 5
The frequency table would be expanded to these values
1, 1, 1, 1, 1, 2, 2, 2, 2, 2, 3, 3, 3, 3, 3, 4, 4, 4, 4, 4
in column C1:C20
Then using quartile.exc(C1:C20,1) I would get 1.25
quartile.exc(C1:C20,2), I would get 2.5
quartile.exc(C1:C20,3), I would get 3.75
Example 2
What I meant was
6, 5
7, 5
8, 5
9, 5
The frequency table would be expanded to these values
6, 6, 6, 6, 6, 7, 7, 7, 7, 7, 8, 8, 8, 8, 8, 9, 9, 9, 9, 9
in column C1:C20
Then using quartile.exc(C1:C20,1) I would get 6.25
quartile.exc(C1:C20,2), I would get 7.5
quartile.exc(C1:C20,3), I would get 8.75
What I meant was
1, 5
2, 5
3, 5
4, 5
The frequency table would be expanded to these values
1, 1, 1, 1, 1, 2, 2, 2, 2, 2, 3, 3, 3, 3, 3, 4, 4, 4, 4, 4
in column C1:C20
Then using quartile.exc(C1:C20,1) I would get 1.25
quartile.exc(C1:C20,2), I would get 2.5
quartile.exc(C1:C20,3), I would get 3.75
Example 2
What I meant was
6, 5
7, 5
8, 5
9, 5
The frequency table would be expanded to these values
6, 6, 6, 6, 6, 7, 7, 7, 7, 7, 8, 8, 8, 8, 8, 9, 9, 9, 9, 9
in column C1:C20
Then using quartile.exc(C1:C20,1) I would get 6.25
quartile.exc(C1:C20,2), I would get 7.5
quartile.exc(C1:C20,3), I would get 8.75
I got a lower ver of Excel in work place so I can't evaluate quartile.exc function accordingly, but after done some research, here's the example which could be helpful to you?
and eventually, what you intend to do here? I mean, you can use quartile.exc formula to get the results you want, don't you?
28738047_c.xlsm
and eventually, what you intend to do here? I mean, you can use quartile.exc formula to get the results you want, don't you?
28738047_c.xlsm
ASKER
Yes I can use quartile.exc to get the results I want. But before I use quartile, I have to expand the frequency table to its individual values.
I have found a way to expand it using excel so we can treat this as closed.
How do I close this?
Can I just delete the question?
I have found a way to expand it using excel so we can treat this as closed.
How do I close this?
Can I just delete the question?
pls check if my comments are useful? if yes, you can accept it as the answer hence this question will be closed.
Else if you found a solution by yourself, you could post the solution here and then click on the Request Attention button to accept your own comment as the answer.
for more info, check this out:
I answered my own question. How do I close the question?
http://support.experts-exchange.com/customer/en/portal/articles/626549-i-answered-my-own-question-how-do-i-close-the-question-?b_id=44
ASKER
See uploaded excel file
In column A to H is my original data.
For subject A,
0 students scored 1,
1 student scored 2,
0 student scored 3,
13 students scored 4 .... etc ....
I constructed a cumulative frequency table from column I to column P where
I added one more score 0
I added 1 to the cumulative frequency from column J to P.
I then find the max of column P.
I put 1 in W1.
I filled in with integer values from 1 in W1 to 110 in column EB. (My original data had more rows which I deleted so that the file is smaller .... max of column P was 110.
From W2 to EB2, I use a formula to recreate the raw data file, so that I can find the Q1, Q2, Q3, min and max. You can use other formula to extract what you want from the 'RAW' data.
I didn't see any uploaded excel here. try upload again?
ASKER
I've requested that this question be closed as follows:
Accepted answer: 0 points for northward's comment #a41035593
for the following reason:
This was what I tried and worked.
Not very clean but it works.
You may have to adapt it for your own needs.
Accepted answer: 0 points for northward's comment #a41035593
for the following reason:
This was what I tried and worked.
Not very clean but it works.
You may have to adapt it for your own needs.
ASKER CERTIFIED SOLUTION
membership
This solution is only available to members.
To access this solution, you must be a member of Experts Exchange.
ASKER
Previous answer has no attachment.
ASKER
This was what I tried and worked.
Not very clean but it works.
You may have to adapt it for your own needs.
To cancel this request and generate a request for Moderator review, state your reason for objecting in the standard comment box and click the 'Object' button. This question will be closed on 10/16/2015 if there are no objections.