Create a graph
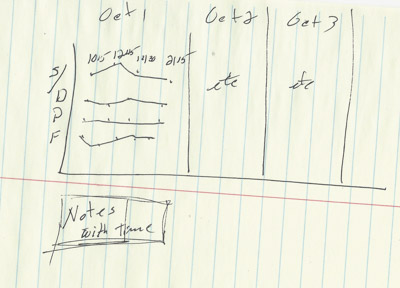
How would I create a graph for Oct and Sept showing only cells with data in them and displaying the time time over the data points for each day; like this...
 VS-chart.xlsm.
VS-chart.xlsm.
ASKER CERTIFIED SOLUTION
membership
This solution is only available to members.
To access this solution, you must be a member of Experts Exchange.
ASKER