ms sql report sum
see attached.
The use will give me selected month like 11/2015 and I am able to get total tran amount group by date.
How can I calcaulate average, total, and buiz day? assume weekend and holiday has total tran count is zero.
2.xls
The use will give me selected month like 11/2015 and I am able to get total tran amount group by date.
How can I calcaulate average, total, and buiz day? assume weekend and holiday has total tran count is zero.
2.xls
Brian Crowe
I am a little unclear on what you are asking for. Are you looking for a SQL query or help with SSRS? If the former then we need schema detail.
ASKER
I am looking sql query
ASKER
just like
datecreated 11/01/2015
totaltrancount 800
that's all.
and I need to get average and total
datecreated 11/01/2015
totaltrancount 800
that's all.
and I need to get average and total
If a question has only a small amount of information and/or the information is vague, then we can only provide general advice and cannot be specific.
For example I could not propose a thorough query solution because:
>>I don't know the table name(s) or column names.
>>There is no sample data to populate tables.
So, all we have is what I presume is the "expected result" where column F is a "rolling averaage" and column G is a "running sum" of the count in column E. It appears that "buiz days" excludes Saturday & Sunday .
.
So, generating some test data:
datediff(day,0,SomeColumn)
For example I could not propose a thorough query solution because:
>>I don't know the table name(s) or column names.
>>There is no sample data to populate tables.
So, all we have is what I presume is the "expected result" where column F is a "rolling averaage" and column G is a "running sum" of the count in column E. It appears that "buiz days" excludes Saturday & Sunday
.So, generating some test data:
CREATE TABLE Table1
    ([SomeColumn] datetime)
;

INSERT INTO Table1
    ([SomeColumn])
VALUES
    ('2015-11-01 00:00:00'),
    ('2015-11-01 00:00:00'),
    ('2015-11-01 00:00:00'),
    ('2015-11-01 00:00:00'),
    ('2015-11-01 00:00:00'),
    ('2015-11-01 00:00:00'),
    ('2015-11-02 00:00:00'),
    ('2015-11-02 00:00:00'),
    ('2015-11-02 00:00:00'),
    ('2015-11-02 00:00:00'),
    ('2015-11-02 00:00:00'),
    ('2015-11-02 00:00:00'),
    ('2015-11-02 00:00:00'),
    ('2015-11-02 00:00:00'),
    ('2015-11-02 00:00:00'),
    ('2015-11-03 00:00:00'),
    ('2015-11-03 00:00:00'),
    ('2015-11-03 00:00:00'),
    ('2015-11-07 00:00:00')
;select
d.*
, sum(some_avg_calc) over(order by dateColumn) as x
, sum(count_all) over(order by dateColumn) as y
, sum(count_bus) over(order by dateColumn) as z
from (
select
cast(SomeColumn as date) as DateColumn
, avg(ABS(CHECKSUM(NewId())) % 14) as some_avg_calc
, count(*) count_all
, count(case when datediff(day,0,SomeColumn) % 7 < 5 then 1 end) count_bus
from table1
group by
cast(SomeColumn as date)
) as d
order by
DateColumn| DateColumn | some_avg_calc | count_all | count_bus | x | y | z |
|------------|---------------|-----------|-----------|----|----|----|
| 2015-11-01 | 4 | 6 | 0 | 4 | 6 | 0 |
| 2015-11-02 | 4 | 9 | 9 | 8 | 15 | 9 |
| 2015-11-03 | 8 | 3 | 3 | 16 | 18 | 12 |
| 2015-11-07 | 12 | 1 | 0 | 28 | 19 | 12 |
datediff(day,0,SomeColumn)
ASKER
I have the database table design attached with this message.
And the average and total is what I hope to generate.
actually, I can add two more columns called average and total if it is easier for you.
Thanks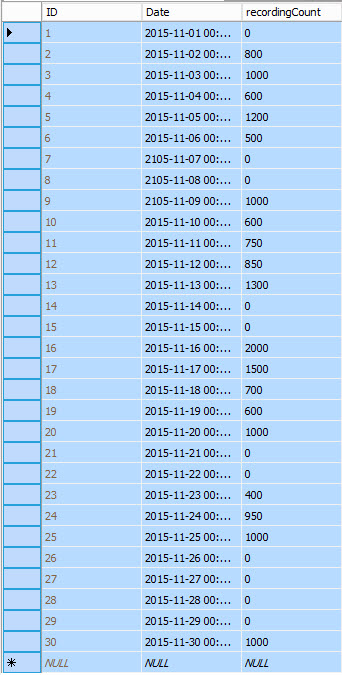
And the average and total is what I hope to generate.
actually, I can add two more columns called average and total if it is easier for you.
Thanks
Is that image your db design?
Is it a table? Or a query result?
Do you intend for us to transcribe that data?
When you do the running sum where does it start or restart?
Is it a table? Or a query result?
Do you intend for us to transcribe that data?
When you do the running sum where does it start or restart?
ASKER
It is a table
This is what we need you to provide to facilitate answering your question:
The idea here is to lower the barrier to entry for experts that would like to help but have jobs of their own and don't want to exchange 15 comments with the original poster to obtain information that should have been provided.
The first two of these can be obtained rather simply utilizing functionality built into SSMS.
http://blog.sqlauthority.com/2012/07/18/sql-server-generate-script-for-schema-and-data-sql-in-sixty-seconds-021-video/
The idea here is to lower the barrier to entry for experts that would like to help but have jobs of their own and don't want to exchange 15 comments with the original poster to obtain information that should have been provided.
Schema information
Sample data preferably scripted
Sample output preferably based on the sample input but not necessarily
An explanation of the logic applied to transition from one to the other if it isn't intuitive by looking at the output
The first two of these can be obtained rather simply utilizing functionality built into SSMS.
http://blog.sqlauthority.com/2012/07/18/sql-server-generate-script-for-schema-and-data-sql-in-sixty-seconds-021-video/
ASKER
Brian,
First of all, thank you for your time helping me. But I think my question is very straight forward.
I have one table with two columns and data is listed as well.
I just hope to generate two more columns which is average and total.
That's all I need. And the sample is also listed with this question.
First of all, thank you for your time helping me. But I think my question is very straight forward.
I have one table with two columns and data is listed as well.
I just hope to generate two more columns which is average and total.
That's all I need. And the sample is also listed with this question.
You have IMAGES of data, but not reusable data.
The "expected result" appears in the supplied spreadsheet, and from that I could reverse engineer the "data"
It was not until I saw the image of the data that I knew that was true however, and nor did I know the column names until then.
I still don't know the table name.
OK, So I can go the extra step, here is some reusable data:
the story continues now with the requestor recognizing that we are not clairvoyants and steps in with some further assistance.
The "expected result" appears in the supplied spreadsheet, and from that I could reverse engineer the "data"
It was not until I saw the image of the data that I knew that was true however, and nor did I know the column names until then.
I still don't know the table name.
OK, So I can go the extra step, here is some reusable data:
ID	Date	recordingCount
1	2015-11-01 00:00:00	0
2	2015-11-02 00:00:00	800
3	2015-11-03 00:00:00	1000
4	2015-11-04 00:00:00	600
5	2015-11-05 00:00:00	1200
6	2015-11-06 00:00:00	500
7	2015-11-07 00:00:00	0
8	2015-11-08 00:00:00	0
9	2015-11-09 00:00:00	1000
10	2015-11-10 00:00:00	600
11	2015-11-11 00:00:00	750
12	2015-11-12 00:00:00	850
13	2015-11-13 00:00:00	1300
14	2015-11-14 00:00:00	0
15	2015-11-15 00:00:00	0
16	2015-11-16 00:00:00	2000
17	2015-11-17 00:00:00	1500
18	2015-11-18 00:00:00	700
19	2015-11-19 00:00:00	600
20	2015-11-20 00:00:00	1000
21	2015-11-21 00:00:00	0
22	2015-11-22 00:00:00	0
23	2015-11-23 00:00:00	400
24	2015-11-24 00:00:00	950
25	2015-11-25 00:00:00	1000
26	2015-11-26 00:00:00	0
27	2015-11-27 00:00:00	0
28	2015-11-28 00:00:00	0
29	2015-11-29 00:00:00	0
30 2015-11-30 00:00:00 1000CREATE TABLE Table1
([ID] int, [Date] datetime, [recordingCount] int)
;
INSERT INTO Table1
([ID], [Date], [recordingCount])
VALUES
(1, '2015-11-01 00:00:00', 0),
(2, '2015-11-02 00:00:00', 800),
(3, '2015-11-03 00:00:00', 1000),
(4, '2015-11-04 00:00:00', 600),
(5, '2015-11-05 00:00:00', 1200),
(6, '2015-11-06 00:00:00', 500),
(7, '2015-11-07 00:00:00', 0),
(8, '2015-11-08 00:00:00', 0),
(9, '2015-11-09 00:00:00', 1000),
(10, '2015-11-10 00:00:00', 600),
(11, '2015-11-11 00:00:00', 750),
(12, '2015-11-12 00:00:00', 850),
(13, '2015-11-13 00:00:00', 1300),
(14, '2015-11-14 00:00:00', 0),
(15, '2015-11-15 00:00:00', 0),
(16, '2015-11-16 00:00:00', 2000),
(17, '2015-11-17 00:00:00', 1500),
(18, '2015-11-18 00:00:00', 700),
(19, '2015-11-19 00:00:00', 600),
(20, '2015-11-20 00:00:00', 1000),
(21, '2015-11-21 00:00:00', 0),
(22, '2015-11-22 00:00:00', 0),
(23, '2015-11-23 00:00:00', 400),
(24, '2015-11-24 00:00:00', 950),
(25, '2015-11-25 00:00:00', 1000),
(26, '2015-11-26 00:00:00', 0),
(27, '2015-11-27 00:00:00', 0),
(28, '2015-11-28 00:00:00', 0),
(29, '2015-11-29 00:00:00', 0),
(30, '2015-11-30 00:00:00', 1000)
;select
*
, SUM(recordingCount) OVER(ORDER BY ID) as Total
from table1
| ID | Date | recordingCount | Total |
|----|----------------------------|----------------|-------|
| 1 | November, 01 2015 00:00:00 | 0 | 0 |
| 2 | November, 02 2015 00:00:00 | 800 | 800 |
| 3 | November, 03 2015 00:00:00 | 1000 | 1800 |
| 4 | November, 04 2015 00:00:00 | 600 | 2400 |
| 5 | November, 05 2015 00:00:00 | 1200 | 3600 |
| 6 | November, 06 2015 00:00:00 | 500 | 4100 |
| 7 | November, 07 2015 00:00:00 | 0 | 4100 |
| 8 | November, 08 2015 00:00:00 | 0 | 4100 |
| 9 | November, 09 2015 00:00:00 | 1000 | 5100 |
| 10 | November, 10 2015 00:00:00 | 600 | 5700 |
| 11 | November, 11 2015 00:00:00 | 750 | 6450 |
| 12 | November, 12 2015 00:00:00 | 850 | 7300 |
| 13 | November, 13 2015 00:00:00 | 1300 | 8600 |
| 14 | November, 14 2015 00:00:00 | 0 | 8600 |
| 15 | November, 15 2015 00:00:00 | 0 | 8600 |
| 16 | November, 16 2015 00:00:00 | 2000 | 10600 |
| 17 | November, 17 2015 00:00:00 | 1500 | 12100 |
| 18 | November, 18 2015 00:00:00 | 700 | 12800 |
| 19 | November, 19 2015 00:00:00 | 600 | 13400 |
| 20 | November, 20 2015 00:00:00 | 1000 | 14400 |
| 21 | November, 21 2015 00:00:00 | 0 | 14400 |
| 22 | November, 22 2015 00:00:00 | 0 | 14400 |
| 23 | November, 23 2015 00:00:00 | 400 | 14800 |
| 24 | November, 24 2015 00:00:00 | 950 | 15750 |
| 25 | November, 25 2015 00:00:00 | 1000 | 16750 |
| 26 | November, 26 2015 00:00:00 | 0 | 16750 |
| 27 | November, 27 2015 00:00:00 | 0 | 16750 |
| 28 | November, 28 2015 00:00:00 | 0 | 16750 |
| 29 | November, 29 2015 00:00:00 | 0 | 16750 |
| 30 | November, 30 2015 00:00:00 | 1000 | 17750 |
select
    *
    , case when recordingCount > 0 then SUM(recordingCount) OVER(ORDER BY ID)
        else 0
      end as Total
from table1


| ID |                       Date | recordingCount | Total |
|----|----------------------------|----------------|-------|
|  1 | November, 01 2015 00:00:00 |              0 |     0 |
|  2 | November, 02 2015 00:00:00 |            800 |   800 |
|  3 | November, 03 2015 00:00:00 |           1000 |  1800 |
|  4 | November, 04 2015 00:00:00 |            600 |  2400 |
|  5 | November, 05 2015 00:00:00 |           1200 |  3600 |
|  6 | November, 06 2015 00:00:00 |            500 |  4100 |
|  7 | November, 07 2015 00:00:00 |              0 |     0 |
|  8 | November, 08 2015 00:00:00 |              0 |     0 |
|  9 | November, 09 2015 00:00:00 |           1000 |  5100 |
| 10 | November, 10 2015 00:00:00 |            600 |  5700 |
| 11 | November, 11 2015 00:00:00 |            750 |  6450 |
| 12 | November, 12 2015 00:00:00 |            850 |  7300 |
| 13 | November, 13 2015 00:00:00 |           1300 |  8600 |
| 14 | November, 14 2015 00:00:00 |              0 |     0 |
| 15 | November, 15 2015 00:00:00 |              0 |     0 |
| 16 | November, 16 2015 00:00:00 |           2000 | 10600 |
| 17 | November, 17 2015 00:00:00 |           1500 | 12100 |
| 18 | November, 18 2015 00:00:00 |            700 | 12800 |
| 19 | November, 19 2015 00:00:00 |            600 | 13400 |
| 20 | November, 20 2015 00:00:00 |           1000 | 14400 |
| 21 | November, 21 2015 00:00:00 |              0 |     0 |
| 22 | November, 22 2015 00:00:00 |              0 |     0 |
| 23 | November, 23 2015 00:00:00 |            400 | 14800 |
| 24 | November, 24 2015 00:00:00 |            950 | 15750 |
| 25 | November, 25 2015 00:00:00 |           1000 | 16750 |
| 26 | November, 26 2015 00:00:00 |              0 |     0 |
| 27 | November, 27 2015 00:00:00 |              0 |     0 |
| 28 | November, 28 2015 00:00:00 |              0 |     0 |
| 29 | November, 29 2015 00:00:00 |              0 |     0 |
| 30 | November, 30 2015 00:00:00 | 1000 | 17750 |select
*
, case when recordingCount > 0 then AVG(recordingCount) OVER(ORDER BY ID)
else 0
end as Average
, case when recordingCount > 0 then SUM(recordingCount) OVER(ORDER BY ID)
else 0
end as Total
from table1
| ID | Date | recordingCount | Average | Total |
|----|----------------------------|----------------|---------|-------|
| 1 | November, 01 2015 00:00:00 | 0 | 0 | 0 |
| 2 | November, 02 2015 00:00:00 | 800 | 400 | 800 |
| 3 | November, 03 2015 00:00:00 | 1000 | 600 | 1800 |
| 4 | November, 04 2015 00:00:00 | 600 | 600 | 2400 |
| 5 | November, 05 2015 00:00:00 | 1200 | 720 | 3600 |
| 6 | November, 06 2015 00:00:00 | 500 | 683 | 4100 |
| 7 | November, 07 2015 00:00:00 | 0 | 0 | 0 |
| 8 | November, 08 2015 00:00:00 | 0 | 0 | 0 |
| 9 | November, 09 2015 00:00:00 | 1000 | 566 | 5100 |
| 10 | November, 10 2015 00:00:00 | 600 | 570 | 5700 |
| 11 | November, 11 2015 00:00:00 | 750 | 586 | 6450 |
| 12 | November, 12 2015 00:00:00 | 850 | 608 | 7300 |
| 13 | November, 13 2015 00:00:00 | 1300 | 661 | 8600 |
| 14 | November, 14 2015 00:00:00 | 0 | 0 | 0 |
| 15 | November, 15 2015 00:00:00 | 0 | 0 | 0 |
| 16 | November, 16 2015 00:00:00 | 2000 | 662 | 10600 |
| 17 | November, 17 2015 00:00:00 | 1500 | 711 | 12100 |
| 18 | November, 18 2015 00:00:00 | 700 | 711 | 12800 |
| 19 | November, 19 2015 00:00:00 | 600 | 705 | 13400 |
| 20 | November, 20 2015 00:00:00 | 1000 | 720 | 14400 |
| 21 | November, 21 2015 00:00:00 | 0 | 0 | 0 |
| 22 | November, 22 2015 00:00:00 | 0 | 0 | 0 |
| 23 | November, 23 2015 00:00:00 | 400 | 643 | 14800 |
| 24 | November, 24 2015 00:00:00 | 950 | 656 | 15750 |
| 25 | November, 25 2015 00:00:00 | 1000 | 670 | 16750 |
| 26 | November, 26 2015 00:00:00 | 0 | 0 | 0 |
| 27 | November, 27 2015 00:00:00 | 0 | 0 | 0 |
| 28 | November, 28 2015 00:00:00 | 0 | 0 | 0 |
| 29 | November, 29 2015 00:00:00 | 0 | 0 | 0 |
| 30 | November, 30 2015 00:00:00 | 1000 | 591 | 17750 |
the story continues now with the requestor recognizing that we are not clairvoyants and steps in with some further assistance.
ASKER CERTIFIED SOLUTION
membership
This solution is only available to members.
To access this solution, you must be a member of Experts Exchange.
ASKER
no matter what...you have the points for sure. I really appreciate your helps. You are the man
>>"no matter what..."
My "story" had an intention. Tossing minimal information into a question isn't "playing the game" well and it causes delays. We are volunteers most of whom cannot afford the time to reverse engineer (or invent) test data, and if you spend a little more time in question preparation you will save a lot of overall time because we don't need to ask so many questions.
There is a time honoured and well proven method to get similar questions answered quickly and accurately, provide these :
a. "sample data" (with schema if possible)
TIPS:
1. Supply the table name(s) as well as column names. It's amazing how many miss doing this and we end up having to invent tables like "table1" "yourtable" etc. ... weird; as it is so much easier for you if we use the correct table name(s).
2. for images it is better to "embed" than to "attach". In the toolbar above the comment edit area, second last from the right, there is an image icon. Using this "embeds" images so they can be seen without having to popup another browser tab. (by the way I did this for you in the images above, so you can now see the impact this has).
3. if using a spreadsheet; use multiple tabs in preference to attaching multiple spreadsheets e.g. one tab per table of sample data plus one for the expected result.
{+edit}
and "sample" (as used in "sample data") also indicates small; i.e. not a lot of data is required.
My "story" had an intention. Tossing minimal information into a question isn't "playing the game" well and it causes delays. We are volunteers most of whom cannot afford the time to reverse engineer (or invent) test data, and if you spend a little more time in question preparation you will save a lot of overall time because we don't need to ask so many questions.
There is a time honoured and well proven method to get similar questions answered quickly and accurately, provide these :
a. "sample data" (with schema if possible)
The data should be "reusable" (nothing is more frustrating than images of data). As Brian identified (ID: 41263644) you can even script this out.
b. "expected results"
This can be an image or spreadsheet tab, but can simply be text as long as it can be read easily.
Important "rules" about any calculations should be written too.
Important "rules" about any calculations should be written too.
TIPS:
1. Supply the table name(s) as well as column names. It's amazing how many miss doing this and we end up having to invent tables like "table1" "yourtable" etc. ... weird; as it is so much easier for you if we use the correct table name(s).
2. for images it is better to "embed" than to "attach". In the toolbar above the comment edit area, second last from the right, there is an image icon. Using this "embeds" images so they can be seen without having to popup another browser tab. (by the way I did this for you in the images above, so you can now see the impact this has).
3. if using a spreadsheet; use multiple tabs in preference to attaching multiple spreadsheets e.g. one tab per table of sample data plus one for the expected result.
{+edit}
and "sample" (as used in "sample data") also indicates small; i.e. not a lot of data is required.