John Ellis
asked on
T-SQL: Manipulating Rows
Hello:
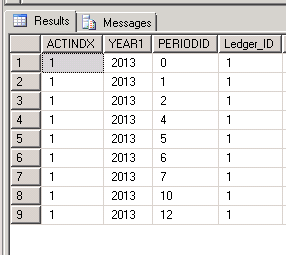
Below is my T-SQL code. Just above the code is a screenshot of the first few columns of the GL10111 table. The only fields that I'm interested in for the purposes of this discussion are the YEAR1 and PERIODID fields.
The one field from my T-SQL code that is incorrect is "Opening Balance".
The period balance field from GL10111 (i.e. the PERDBLNC field) "stands for" Period Balance. But, truthfully, that field in the table does not hold the Period Balance, unless the Period ID is 0. The Period ID of 0 represents the beginning balance of an account (i.e. the ACTINDX field).
Other than where Period ID is 0, each succeeding row for that account and year (i.e. the YEAR1 field) holds the Net Change which is GL10111.DEBITAMT - GL10111.CRDTAMNT.
For each row returned from my T-SQL code, I need the PERDBLNC where Period ID is 0 plus the PERDBLNC for the PERIODID of the previous row. That's the first thing that I need, on "row manipulation".
Also, this table does not display a row for a Period where there is no DEBITAMT or CRDTAMNT for that Period. That's why my screenshot does not show, for example, "3" for PERIODID in 2013. This means that there was no activity for that account for Period 3.
Is there a way to have my code show rows (Period IDs) where there was no activity for the period?
Thanks! Much appreciated!
John
SELECT DISTINCT GL10111.ACTINDX as [Account Index], GL00105.ACTNUMST as [Account],
GL00100.ACTDESCR as [Account Description],
GL10111.YEAR1 as [Year], GL10111.PERIODID as [Period],
GL10111.DEBITAMT as [Debit],
GL10111.CRDTAMNT as [Credit],
sum(GL10111.PERDBLNC) - sum(case when GL10111.PERIODID <> 0 then GL10111.DEBITAMT -
GL10111.CRDTAMNT else 0 end) as [Opening Balance],
sum(case when GL10111.PERIODID <> 0 then GL10111.DEBITAMT - GL10111.CRDTAMNT else 0 end) as [Net Change],
sum(GL10111.PERDBLNC) As [Ending Balance]
FROM GL10111
INNER JOIN GL00100 ON GL10111.ACTINDX = GL00100.ACTINDX
INNER JOIN GL00105 ON GL00100.ACTINDX = GL00105.ACTINDX
WHERE GL10111.YEAR1 > 2010
GROUP BY GL10111.PERIODID, GL10111.ACTINDX, GL00105.ACTNUMST, GL00100.ACTDESCR, GL10111.DEBITAMT,
GL10111.CRDTAMNT, GL10111.YEAR1PortletPaul
Never use "select distinct" and group by in a single select. The "select distinct" is entirely redundant in such queries.
Please provide some sample data preferably in a usable form (insert statements not screenshots)
ASKER
Hi:
I apologize, for the stupid question. But, is there a way to extract insert statements somehow from the table in SSMS?
John
I apologize, for the stupid question. But, is there a way to extract insert statements somehow from the table in SSMS?
John
Use the "Generate Scripts..." task
http://blog.sqlauthority.com/2012/07/18/sql-server-generate-script-for-schema-and-data-sql-in-sixty-seconds-021-video/
http://blog.sqlauthority.com/2012/07/18/sql-server-generate-script-for-schema-and-data-sql-in-sixty-seconds-021-video/
ASKER
Hi:
Is this going to pull data from one of our databases or just show the columns of the table? I'm not allowed to provide sensitive financial data.
John
Is this going to pull data from one of our databases or just show the columns of the table? I'm not allowed to provide sensitive financial data.
John
Wait....
sample data is NOT a few rows from the result of your query, but should be a "sample" of your problem and presented PER TABLE.
often it is easier to generate this manually because the last thing anyone needs is to unscramble a lot of data, remembering that we should also have the "expected result" (so if you start small it is easier for you to present the expected result also).
The basic question here is to produce rows when there is no matching row in the source data.
The fundamental approach to this is to create a table that does have all the periods in it, then left join to the source data. Here is an example
The fundamental approach to this is to create a table that does have all the periods in it, then left join to the source data. Here is an example
with p as (
           select 1 as perno union all
           select 2 as perno union all
           select 3 as perno union all
           select 4 as perno union all
           select 5 as perno union all
           select 6 as perno union all
           select 7 as perno union all
           select 8 as perno union all
           select 9 as perno union all
           select 10 as perno union all
           select 11 as perno union all
           select 12 as perno
, gdata as (
        SELECT
                GL10111.ACTINDX       AS [Account Index]
              , GL00105.ACTNUMST      AS [Account]
              , GL00100.ACTDESCR      AS [Account Description]
              , GL10111.YEAR1         AS [Year]
              , GL10111.PERIODID      AS [Period]
              , GL10111.DEBITAMT      AS [Debit]
              , GL10111.CRDTAMNT      AS [Credit]
              , SUM(GL10111.PERDBLNC) - SUM(CASE
                        WHEN GL10111.PERIODID <> 0 THEN GL10111.DEBITAMT -
                        GL10111.CRDTAMNT
                        ELSE 0
                END)                  AS [Opening Balance]
              , SUM(CASE
                        WHEN GL10111.PERIODID <> 0 THEN GL10111.DEBITAMT - GL10111.CRDTAMNT
                        ELSE 0
                END)                  AS [Net Change]
              , SUM(GL10111.PERDBLNC) AS [Ending Balance]
        FROM GL10111
                INNER JOIN GL00100 ON GL10111.ACTINDX = GL00100.ACTINDX
                INNER JOIN GL00105 ON GL00100.ACTINDX = GL00105.ACTINDX
        WHERE GL10111.YEAR1 > 2010
        GROUP BY
                GL10111.PERIODID
              , GL10111.ACTINDX
              , GL00105.ACTNUMST
              , GL00100.ACTDESCR
              , GL10111.DEBITAMT
              , GL10111.CRDTAMNT
              , GL10111.YEAR1
        )
select
*
from p
left join gdata on p.perno = gdata.Period
from with y as (
select 2010 as yno union all
select 2011 as yno union all
select 2012 as yno union all
select 2013 as yno union all
select 2014 as yno union all
select 2015 as yno union all
select 2016 as yno
)
, p as (
select 1 as perno union all
select 2 as perno union all
select 3 as perno union all
select 4 as perno union all
select 5 as perno union all
select 6 as perno union all
select 7 as perno union all
select 8 as perno union all
select 9 as perno union all
select 10 as perno union all
select 11 as perno union all
select 12 as perno
, gdata as (
SELECT
GL10111.ACTINDX AS [Account Index]
, GL00105.ACTNUMST AS [Account]
, GL00100.ACTDESCR AS [Account Description]
, GL10111.YEAR1 AS [Year]
, GL10111.PERIODID AS [Period]
, GL10111.DEBITAMT AS [Debit]
, GL10111.CRDTAMNT AS [Credit]
, SUM(GL10111.PERDBLNC) - SUM(CASE
WHEN GL10111.PERIODID <> 0 THEN GL10111.DEBITAMT -
GL10111.CRDTAMNT
ELSE 0
END) AS [Opening Balance]
, SUM(CASE
WHEN GL10111.PERIODID <> 0 THEN GL10111.DEBITAMT - GL10111.CRDTAMNT
ELSE 0
END) AS [Net Change]
, SUM(GL10111.PERDBLNC) AS [Ending Balance]
FROM GL10111
INNER JOIN GL00100 ON GL10111.ACTINDX = GL00100.ACTINDX
INNER JOIN GL00105 ON GL00100.ACTINDX = GL00105.ACTINDX
WHERE GL10111.YEAR1 > 2010
GROUP BY
GL10111.PERIODID
, GL10111.ACTINDX
, GL00105.ACTNUMST
, GL00100.ACTDESCR
, GL10111.DEBITAMT
, GL10111.CRDTAMNT
, GL10111.YEAR1
)
select
*
from y
CROSS JOIN p
left join gdata on y.yno = gdata.[Year] and p.perno = gdata.PeriodASKER
Thanks so much, Paul!
Also, for each row returned from T-SQL code, I need the PERDBLNC where Period ID is 0 plus the PERDBLNC for the PERIODID of the previous row.
Is there a way to do this?
John
Also, for each row returned from T-SQL code, I need the PERDBLNC where Period ID is 0 plus the PERDBLNC for the PERIODID of the previous row.
Is there a way to do this?
John
I'm really not sure what you mean, can you illustrate by an example?
In particular are you trying to do this AND aggregate at the same time
==========================
sample data + expected result
Those 2 things are the secret to a successful, quickly and accurately answered question.
It is so successful it even has a name:
"Short, Self Contained, Correct (Compilable), Example"
please visit http://sscce.org/ for the logic of this.
John,
Are you looking to create a historical trial balance? If so, you might want to take a look at my code for this:
https://victoriayudin.com/2015/08/13/refreshable-excel-report-for-historical-gl-trial-balance-in-dynamics-gp/
Are you looking to create a historical trial balance? If so, you might want to take a look at my code for this:
https://victoriayudin.com/2015/08/13/refreshable-excel-report-for-historical-gl-trial-balance-in-dynamics-gp/
ASKER
Hi All:
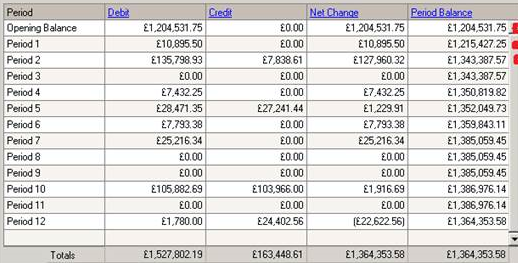
The embedded screenshot of the Dynamics GP History Summary window is showing what I need.
Notice that the Period Balance column contains the beginning balance from Period 0 and adds that balance to each period's Net Change (Debit - Credit) to produce an Ending Balance for that Period.
So, I need for the T-SQL code to carry over the Ending Balance for the previous period as the Opening Balance for the next period.
The GL10111 table's PERDBLNC column, again, is not a true Period Balance. It is, really, only a Net Change column.
Ultimately, I need for each succeeding row (Period ID) to have the PERDBLNC where Period ID is 0 plus the PERDBLNC for the Period ID of the previous row.
Thank you!
John
It's probably not the most elegant code, but if you know you will always have 12 periods it will work:
declare @account varchar(20) = '1020-000-00'
declare @yr int = 2015

select 'Opening Balance' Period, sum(case g.PERIODID when 0 then g.PERDBLNC else 0 end) [Period Balance], 1 [Sort Order]
from GL10111 g
where g.YEAR1 = @yr and g.ACTINDX in (select ACTINDX from GL00105 where ACTNUMST = @account)
union
select 'Period 1', sum(case when g.PERIODID <=1 then g.DEBITAMT-g.CRDTAMNT else 0 end), 2 [Sort Order]
from GL10111 g
where g.YEAR1 = @yr and g.ACTINDX in (select ACTINDX from GL00105 where ACTNUMST = @account)
union
select 'Period 2', sum(case when g.PERIODID <=2 then g.DEBITAMT-g.CRDTAMNT else 0 end), 3 [Sort Order]
from GL10111 g
where g.YEAR1 = @yr and g.ACTINDX in (select ACTINDX from GL00105 where ACTNUMST = @account)
union
select 'Period 3', sum(case when g.PERIODID <=3 then g.DEBITAMT-g.CRDTAMNT else 0 end), 4 [Sort Order]
from GL10111 g
where g.YEAR1 = @yr and g.ACTINDX in (select ACTINDX from GL00105 where ACTNUMST = @account)
union
select 'Period 4', sum(case when g.PERIODID <=4 then g.DEBITAMT-g.CRDTAMNT else 0 end), 5 [Sort Order]
from GL10111 g
where g.YEAR1 = @yr and g.ACTINDX in (select ACTINDX from GL00105 where ACTNUMST = @account)
union
select 'Period 5', sum(case when g.PERIODID <=5 then g.DEBITAMT-g.CRDTAMNT else 0 end), 6 [Sort Order]
from GL10111 g
where g.YEAR1 = @yr and g.ACTINDX in (select ACTINDX from GL00105 where ACTNUMST = @account)
union
select 'Period 6', sum(case when g.PERIODID <=6 then g.DEBITAMT-g.CRDTAMNT else 0 end), 7 [Sort Order]
from GL10111 g
where g.YEAR1 = @yr and g.ACTINDX in (select ACTINDX from GL00105 where ACTNUMST = @account)
union
select 'Period 7', sum(case when g.PERIODID <=7 then g.DEBITAMT-g.CRDTAMNT else 0 end), 8 [Sort Order]
from GL10111 g
where g.YEAR1 = @yr and g.ACTINDX in (select ACTINDX from GL00105 where ACTNUMST = @account)
union
select 'Period 8', sum(case when g.PERIODID <=8 then g.DEBITAMT-g.CRDTAMNT else 0 end), 9 [Sort Order]
from GL10111 g
where g.YEAR1 = @yr and g.ACTINDX in (select ACTINDX from GL00105 where ACTNUMST = @account)
union
select 'Period 9', sum(case when g.PERIODID <=9 then g.DEBITAMT-g.CRDTAMNT else 0 end), 10 [Sort Order]
from GL10111 g
where g.YEAR1 = @yr and g.ACTINDX in (select ACTINDX from GL00105 where ACTNUMST = @account)
union
select 'Period 10', sum(case when g.PERIODID <=10 then g.DEBITAMT-g.CRDTAMNT else 0 end), 11 [Sort Order]
from GL10111 g
where g.YEAR1 = @yr and g.ACTINDX in (select ACTINDX from GL00105 where ACTNUMST = @account)
union
select 'Period 11', sum(case when g.PERIODID <=11 then g.DEBITAMT-g.CRDTAMNT else 0 end), 12 [Sort Order]
from GL10111 g
where g.YEAR1 = @yr and g.ACTINDX in (select ACTINDX from GL00105 where ACTNUMST = @account)
union
select 'Period 12', sum(g.DEBITAMT-g.CRDTAMNT), 13 [Sort Order]
from GL10111 g
where g.YEAR1 = @yr and g.ACTINDX in (select ACTINDX from GL00105 where ACTNUMST = @account)

order by [Sort Order]
Crickey! could I get that balance please? but oh how I yearn for some sample data (not an image of data)
I don't have time right now to generate the data and than write a query, but you want to be considering
SUM(case expression here) OVER(partition by somecolumnshere order by periodid) as PeriodBalance
In other words use SUM() OVER() produces a "running sum" just like you see as Period Balance
I don't have time right now to generate the data and than write a query, but you want to be considering
SUM(case expression here) OVER(partition by somecolumnshere order by periodid) as PeriodBalance
In other words use SUM() OVER() produces a "running sum" just like you see as Period Balance
Here is some "sample data"
It does not need to reveal anything private and should represent the problem(s)
that is easily traced to to an expected result:
============
and then the experts can use that data and expected result to arrive at a possible solution, such as this:
=====
see all the above working at: http://sqlfiddle.com/#!6/01ec5/3
=====
I assume you can apply the techniques above to your particular tables.
nb: You don't have to adopt single character aliases like o p y
It does not need to reveal anything private and should represent the problem(s)
that is easily traced to to an expected result:
CREATE TABLE Table1
    ([AccountNo] varchar(4), [YearNo] int, [PeriodID] int, [Amount] int)
;

INSERT INTO Table1
    ([AccountNo], [YearNo], [PeriodID], [Amount])
VALUES
    ('abcd', 2015, 0, 1000000),
    ('abcd', 2015, 1, -25000),
    ('abcd', 2015, 1, 50000),
    ('abcd', 2015, 2, -25000),
    ('abcd', 2015, 2, 50000),
    ('abcd', 2015, 4, -25000),
    ('abcd', 2015, 4, 50000),
    ('abcd', 2015, 8, -25000),
    ('abcd', 2015, 8, 50000)
;| AccountNo | YearNo | PeriodID | Credits | Debits | PeriodBalance |
|-----------|--------|----------|---------|--------|---------------|
| abcd | 2015 | 1 | 25000 | 50000 | 1025000 |
| abcd | 2015 | 2 | 25000 | 50000 | 1050000 |
| abcd | 2015 | 3 | 0 | 0 | 1050000 |
| abcd | 2015 | 4 | 25000 | 50000 | 1075000 |
| abcd | 2015 | 5 | 0 | 0 | 1075000 |
| abcd | 2015 | 6 | 0 | 0 | 1075000 |
| abcd | 2015 | 7 | 0 | 0 | 1075000 |
| abcd | 2015 | 8 | 25000 | 50000 | 1100000 |
| abcd | 2015 | 9 | 0 | 0 | 1100000 |
| abcd | 2015 | 10 | 0 | 0 | 1100000 |
| abcd | 2015 | 11 | 0 | 0 | 1100000 |
| abcd | 2015 | 12 | 0 | 0 | 1100000 |============
and then the experts can use that data and expected result to arrive at a possible solution, such as this:
with y as (
           select 2015 as num
          )
, p as (
           select 1 as perno union all
           select 2 as perno union all
           select 3 as perno union all
           select 4 as perno union all
           select 5 as perno union all
           select 6 as perno union all
           select 7 as perno union all
           select 8 as perno union all
           select 9 as perno union all
           select 10 as perno union all
           select 11 as perno union all
           select 12 as perno
       )
, o as (
      select
      AccountNo, YearNo,  Amount as Balance
      from table1
      where YearNo in (select y.num from y)
      and PeriodID = 0
      )
select
      AccountNo
    , YearNo
    , PeriodID
    , Credits
    , Debits
    , SUM(Balance - Credits + Debits) OVER(partition by AccountNo, YearNo
                                       order by PeriodID)
      as PeriodBalance
from (
      select
            o.AccountNo
          , y.num      as YearNo
          , p.perno    as PeriodID
          , case when p.perno = 1 then o.Balance else 0 end Balance
          , ISNULL(SUM(case when dat.Amount < 0 then dat.Amount*-1 end),0) as Credits
          , ISNULL(SUM(case when dat.Amount >=0 then dat.Amount end),0)    as Debits
      from y
      cross join p
      left join o on y.num = o.yearno
      left join table1 dat on o.AccountNo = dat.AccountNo
                          and y.num = dat.yearno
                          and p.perno = dat.periodid
      group by
            o.AccountNo
          , y.num
          , p.perno
          , o.Balance
      ) derived
;=====
see all the above working at: http://sqlfiddle.com/#!6/01ec5/3
=====
I assume you can apply the techniques above to your particular tables.
nb: You don't have to adopt single character aliases like o p y
ASKER
Hi:
I'm still lost on how to "bring forward" the Ending Balance from the previous row (period ID) as the Opening Balance for the next row (period ID)
Can't T-SQL's "ROW_NUMBER()" syntax or something like that be used? Do you have to create a "virtual" table and derive data from it?
John
I'm still lost on how to "bring forward" the Ending Balance from the previous row (period ID) as the Opening Balance for the next row (period ID)
Can't T-SQL's "ROW_NUMBER()" syntax or something like that be used? Do you have to create a "virtual" table and derive data from it?
John
ASKER
Regarding my previous comment, this is the best that I have so far:
SELECT GL10111.ACTINDX as [Account Index], GL00105.ACTNUMST as [Account],
GL00100.ACTDESCR as [Account Description],
GL10111.YEAR1 as [Year], GL10111.PERIODID as [Period],
ROW_NUMBER() over (partition by GL10111.ACTINDX, GL10111.YEAR1 order by GL10111.PERIODID) as Row,
case when GL10111.PERIODID = 0 then 0 ELSE (select sum(GL10111.PERDBLNC) where
ROW_NUMBER() over (partition by GL10111.ACTINDX, GL10111.YEAR1 order by GL10111.PERIODID)=
ROW_NUMBER() over (partition by GL10111.ACTINDX, GL10111.YEAR1 order by GL10111.PERIODID)-1) end as [Opening Balance],
GL10111.DEBITAMT as [Debit],
GL10111.CRDTAMNT as [Credit],
sum(GL10111.DEBITAMT - GL10111.CRDTAMNT)
as [Net Change],
sum(GL10111.PERDBLNC) As [Ending Balance]
FROM GL10111
INNER JOIN GL00100 ON GL10111.ACTINDX = GL00100.ACTINDX
INNER JOIN GL00105 ON GL00100.ACTINDX = GL00105.ACTINDX
WHERE GL10111.YEAR1 = 2012
GROUP BY GL10111.PERIODID, GL10111.ACTINDX, GL00105.ACTNUMST, GL00100.ACTDESCR, GL10111.DEBITAMT,
GL10111.CRDTAMNT, GL10111.YEAR1, GL10111.PERDBLNC
ORDER BY GL10111.ACTINDX, GL10111.YEAR1, GL10111.PERIODID
SUM () OVER (PARTITION BY .... ORDER BY ...)
in the image you display above (£1m plus) the last column is a running sum.
You can produce a running sum using the sum function combined with the over clause.
I again ask you to provide sample data. From that i can assist more. Without it we end up in a long cycle of words.
in the image you display above (£1m plus) the last column is a running sum.
You can produce a running sum using the sum function combined with the over clause.
I again ask you to provide sample data. From that i can assist more. Without it we end up in a long cycle of words.
Can we go back over what this question is about?
You are NEVER going to SOLVE question 2 with this:
you MUST supply EVERY POSSIBLE YEAR + PERIOD (that you are interested in) then join the data to that list of years/periods.
I do hope that point has been made by now - and that I have demonstrated how to solve that.
Here is what I regard is "sample data" - I should not have to prepare sample data in truth that is your job. As you can see there is no private info involved in that sample data but if you were worried about that then simply replace anything private with a non-private equivalent.
Now that I have some data I can run queries. This therefore allows any expert to come along and help to answer your question (quickly).
So, the first query I will run to demonstrate that I DO want the opening balance, but I only want it ONCE.
Final notes.
- I need the PERDBLNC where Period ID is 0 plus the PERDBLNC for the PERIODID of the previous row. That's the first thing that I need, on "row manipulation".
- this table does not display a row for a Period where there is no DEBITAMT or CRDTAMNT
You are NEVER going to SOLVE question 2 with this:
FROM GL10111
INNER JOIN GL00100 ON GL10111.ACTINDX = GL00100.ACTINDX
INNER JOIN GL00105 ON GL00100.ACTINDX = GL00105.ACTINDX
WHERE GL10111.YEAR1 = 2012
To solve that question INNER JOIN GL00100 ON GL10111.ACTINDX = GL00100.ACTINDX
INNER JOIN GL00105 ON GL00100.ACTINDX = GL00105.ACTINDX
WHERE GL10111.YEAR1 = 2012
you MUST supply EVERY POSSIBLE YEAR + PERIOD (that you are interested in) then join the data to that list of years/periods.
I do hope that point has been made by now - and that I have demonstrated how to solve that.
Here is what I regard is "sample data" - I should not have to prepare sample data in truth that is your job. As you can see there is no private info involved in that sample data but if you were worried about that then simply replace anything private with a non-private equivalent.
CREATE TABLE GL00100     ([ACTINDX] varchar(4), [ACTNUMST] int, [ACTDESCR] varchar(25));

INSERT INTO GL00100     ([ACTINDX], [ACTNUMST], [ACTDESCR]) VALUES     ('abcd', 123, 'account is described here');

CREATE TABLE GL00105     ([ACTINDX] varchar(4), [ACTNUMST] varchar(12));

INSERT INTO GL00105     ([ACTINDX],[ACTNUMST]) VALUES     ('abcd','actnumst...')
;

CREATE TABLE GL10111
    ([ACTINDX] varchar(4), [CRDTAMNT] int, [DEBITAMT] int, [PERDBLNC] int, [PERIODID] int, [YEAR1] int)
;

INSERT INTO GL10111
    ([ACTINDX], [CRDTAMNT], [DEBITAMT], [PERDBLNC], [PERIODID], [YEAR1])
VALUES
    ('abcd',    0,    0, 20000, 0, 2013),
    ('abcd', 1000, 5000, 0, 2, 2013),
    ('abcd', 1000, 5000, 0, 4, 2013),
    ('abcd', 1000, 5000, 0, 6, 2013),
    ('abcd', 1000, 5000, 0, 8, 2013),
    ('abcd', 1000, 5000, 0, 10, 2013)
;Now that I have some data I can run queries. This therefore allows any expert to come along and help to answer your question (quickly).
So, the first query I will run to demonstrate that I DO want the opening balance, but I only want it ONCE.
/* Demonstrate getting the opening balance */
with y as (
           select 2013 as yno
        )
, p as (
           select 1 as perno union all /* no period zero in this list !!! */
           select 2 as perno union all
           select 3 as perno union all
           select 4 as perno union all
           select 5 as perno union all
           select 6 as perno union all
           select 7 as perno union all
           select 8 as perno union all
           select 9 as perno union all
           select 10 as perno union all
           select 11 as perno union all
           select 12 as perno
       )
select
      y.yno
    , p.perno
    , opbal.actindx
    , case when p.perno = 1 then opbal.PERDBLNC else 0 end opening_bal
from y
cross join p
             /* the following join gets the opening balance ONLY, aligned to period 1 */
INNER join GL10111 opbal on y.yno = opbal.year1
                        and opbal.periodid = 0
;| yno | perno | actindx | opening_bal |
|------|-------|---------|-------------|
| 2013 | 1 | abcd | 20000 |
| 2013 | 2 | abcd | 0 |
| 2013 | 3 | abcd | 0 |
| 2013 | 4 | abcd | 0 |
| 2013 | 5 | abcd | 0 |
| 2013 | 6 | abcd | 0 |
| 2013 | 7 | abcd | 0 |
| 2013 | 8 | abcd | 0 |
| 2013 | 9 | abcd | 0 |
| 2013 | 10 | abcd | 0 |
| 2013 | 11 | abcd | 0 |
| 2013 | 12 | abcd | 0 |/* now add the remaining logic */
with y as (
select 2013 as yno
)
, p as (
select 1 as perno union all /* not no period zero */
select 2 as perno union all
select 3 as perno union all
select 4 as perno union all
select 5 as perno union all
select 6 as perno union all
select 7 as perno union all
select 8 as perno union all
select 9 as perno union all
select 10 as perno union all
select 11 as perno union all
select 12 as perno
)
select
*
, SUM(period_total)
OVER(partition by actindx, yno order by perno)
as running_total
from (
select
y.yno
, p.perno
, opbal.actindx
, GL00105.ACTNUMST
, GL00100.ACTDESCR
, SUM(
case when p.perno = 1
then opbal.PERDBLNC + ISNULL(trans.CRDTAMNT,0) - ISNULL(trans.DEBITAMT,0)
else
ISNULL(trans.CRDTAMNT,0) - ISNULL(trans.DEBITAMT,0)
end
) as period_total
from y
cross join p
/* the following join gets the opening balance ONLY, aligned to period 1 */
INNER join GL10111 opbal on y.yno = opbal.year1
and opbal.periodid = 0
/* now join the other transaction data and reference tables */
left join GL10111 trans on y.yno = trans.year1
and p.perno = trans.periodid
LEFT JOIN GL00100 ON opbal.ACTINDX = GL00100.ACTINDX
LEFT JOIN GL00105 ON opbal.ACTINDX = GL00105.ACTINDX
GROUP BY
y.yno
, p.perno
, opbal.actindx
, GL00105.ACTNUMST
, GL00100.ACTDESCR
) derived
;| yno | perno | actindx | ACTNUMST | ACTDESCR | period_total | running_total |
|------|-------|---------|-------------|---------------------------|--------------|---------------|
| 2013 | 1 | abcd | actnumst... | account is described here | 20000 | 20000 |
| 2013 | 2 | abcd | actnumst... | account is described here | -4000 | 16000 |
| 2013 | 3 | abcd | actnumst... | account is described here | 0 | 16000 |
| 2013 | 4 | abcd | actnumst... | account is described here | -4000 | 12000 |
| 2013 | 5 | abcd | actnumst... | account is described here | 0 | 12000 |
| 2013 | 6 | abcd | actnumst... | account is described here | -4000 | 8000 |
| 2013 | 7 | abcd | actnumst... | account is described here | 0 | 8000 |
| 2013 | 8 | abcd | actnumst... | account is described here | -4000 | 4000 |
| 2013 | 9 | abcd | actnumst... | account is described here | 0 | 4000 |
| 2013 | 10 | abcd | actnumst... | account is described here | -4000 | 0 |
| 2013 | 11 | abcd | actnumst... | account is described here | 0 | 0 |
| 2013 | 12 | abcd | actnumst... | account is described here | 0 | 0 |
Final notes.
- I may have the credit and debits around the wrong way - but that is not material for me. You can correct that I trust. But by now BOTH your initial questions have been answeredI believe as well as another one which was to produce a running total.
- I have now spent quite some time on this and will await your review with interest.
- Please note how much more can be achieved with sample data and the expected result (that image represents the "expected result")
ASKER
Victoria:
Is there a way of creating the code that you suggested, without having to use variables?
John
Is there a way of creating the code that you suggested, without having to use variables?
John
John,
Try this:
Try this:
select a.ACTNUMST Account, g.Period, g.[Period Balance] from
(select ACTINDX, 'Opening Balance' Period, sum(case PERIODID when 0 then PERDBLNC else 0 end) [Period Balance]
from GL10111
group by ACTINDX
union all
select ACTINDX, 'Period 1', sum(case when PERIODID <=1 then  DEBITAMT - CRDTAMNT else 0 end)
from GL10111
group by ACTINDX
union all
select ACTINDX, 'Period 2', sum(case when PERIODID <=2 then  DEBITAMT - CRDTAMNT else 0 end)
from GL10111
group by ACTINDX
union all
select ACTINDX, 'Period 3', sum(case when PERIODID <=3 then  DEBITAMT - CRDTAMNT else 0 end)
from GL10111
group by ACTINDX
union all
select ACTINDX, 'Period 4', sum(case when PERIODID <=4 then DEBITAMT - CRDTAMNT else 0 end)
from GL10111
group by ACTINDX
union all
select ACTINDX, 'Period 5', sum(case when PERIODID <=5 then DEBITAMT - CRDTAMNT else 0 end)
from GL10111
group by ACTINDX
union all
select ACTINDX, 'Period 6', sum(case when PERIODID <=6 then DEBITAMT - CRDTAMNT else 0 end)
from GL10111
group by ACTINDX
union all
select ACTINDX, 'Period 7', sum(case when PERIODID <=7 then DEBITAMT - CRDTAMNT else 0 end)
from GL10111
group by ACTINDX
union all
select ACTINDX, 'Period 8', sum(case when PERIODID <=8 then DEBITAMT - CRDTAMNT else 0 end)
from GL10111
group by ACTINDX
union all
select ACTINDX, 'Period 9', sum(case when PERIODID <=9 then DEBITAMT - CRDTAMNT else 0 end)
from GL10111
group by ACTINDX
union all
select ACTINDX, 'Period 10', sum(case when PERIODID <=10 then DEBITAMT - CRDTAMNT else 0 end)
from GL10111
group by ACTINDX
union all
select ACTINDX, 'Period 11', sum(case when PERIODID <=11 then DEBITAMT - CRDTAMNT else 0 end)
from GL10111
group by ACTINDX
union all
select ACTINDX, 'Period 12', sum(DEBITAMT - CRDTAMNT)
from GL10111
group by ACTINDX) g
inner join GL00105 a
	on g.ACTINDX = a.ACTINDX
Refer to this related question
John,
Q1: Do you still need to solve getting all periods using the final query of that question?
Q2: What version of SQL Server do you actually use?
John,
Q1: Do you still need to solve getting all periods using the final query of that question?
Q2: What version of SQL Server do you actually use?
ASKER
Hi!
Q1: Yes.
Q2: SQL Server 2008.
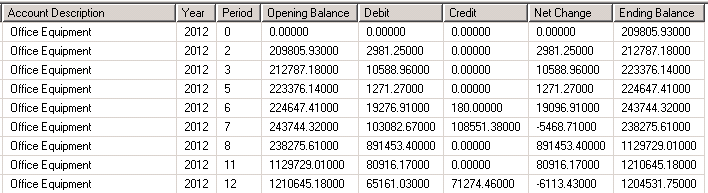
Except for the first two columns, which represent the account index and the account number, this is data that I'm seeing from my query in the "related question".
In the GL10111 table, there are simply no rows generated for account numbers where there are no debits and credits for those periods (i.e. rows). That's why, for example, you see no "Period 1" within the screenshot below.
I want to see periods, where the table does not produce any. And, I want the Opening Balance and Ending Balance to pull from the previous row for such periods, along with 0 for Debit and 0 for Credit.
Thanks, so much!
John
Q1: Yes.
Q2: SQL Server 2008.
Except for the first two columns, which represent the account index and the account number, this is data that I'm seeing from my query in the "related question".
In the GL10111 table, there are simply no rows generated for account numbers where there are no debits and credits for those periods (i.e. rows). That's why, for example, you see no "Period 1" within the screenshot below.
I want to see periods, where the table does not produce any. And, I want the Opening Balance and Ending Balance to pull from the previous row for such periods, along with 0 for Debit and 0 for Credit.
Thanks, so much!
John
Can you copy/paste that as text please not an image?
ASKER
As "text"? How?
John
John
That image does not directly assist. Can you copy that information and paste as text?
Paste it "as is" into a new comment, or use a code block if familiar with using them.
I am only with a phone right now. Hopefully with your data and me with a real keyboard we can conclude this soon.
Paste it "as is" into a new comment, or use a code block if familiar with using them.
I am only with a phone right now. Hopefully with your data and me with a real keyboard we can conclude this soon.
ASKER
Hi Paul:
I'm pasting as/is, but it does not look pretty. I hope it helps, in any case. :) If not, please let me know and I will try to find a way.
I'm pasting as/is, but it does not look pretty. I hope it helps, in any case. :) If not, please let me know and I will try to find a way.
Account Description Year Period Opening Balance Debit Credit Net Change Ending Balance
Office Equipment 2012 0 0.00000 0.00000 0.00000 0.00000 209805.93000
Office Equipment 2012 2 209805.93000 2981.25000 0.00000 2981.25000 212787.18000
Office Equipment 2012 3 212787.18000 10588.96000 0.00000 10588.96000 223376.14000
Office Equipment 2012 5 223376.14000 1271.27000 0.00000 1271.27000 224647.41000
Office Equipment 2012 6 224647.41000 19276.91000 180.00000 19096.91000 243744.32000
Office Equipment 2012 7 243744.32000 103082.67000 108551.38000 -5468.71000 238275.61000
Office Equipment 2012 8 238275.61000 891453.40000 0.00000 891453.40000 1129729.01000
Office Equipment 2012 11 1129729.01000 80916.17000 0.00000 80916.17000 1210645.18000
Office Equipment 2012 12 1210645.18000 65161.03000 71274.46000 -6113.43000 1204531.75000
Accumulated Depreciation - O. E. 2012 0 0.00000 0.00000 0.00000 0.00000 -70054.62000
Accumulated Depreciation - O. E. 2012 1 -70054.62000 0.00000 3744.02000 -3744.02000 -73798.64000
Accumulated Depreciation - O. E. 2012 2 -73798.64000 0.00000 3806.59000 -3806.59000 -77605.23000
Accumulated Depreciation - O. E. 2012 3 -77605.23000 0.00000 4026.97000 -4026.97000 -81632.20000
Accumulated Depreciation - O. E. 2012 4 -81632.20000 0.00000 3979.65000 -3979.65000 -85611.85000
Accumulated Depreciation - O. E. 2012 5 -85611.85000 0.00000 4006.12000 -4006.12000 -89617.97000
Accumulated Depreciation - O. E. 2012 6 -89617.97000 0.00000 4339.22000 -4339.22000 -93957.19000
Accumulated Depreciation - O. E. 2012 7 -93957.19000 13471.32000 4466.98000 9004.34000 -84952.85000
Accumulated Depreciation - O. E. 2012 8 -84952.85000 0.00000 22759.26000 -22759.26000 -107712.11000
Accumulated Depreciation - O. E. 2012 9 -107712.11000 0.00000 23276.51000 -23276.51000 -130988.62000
Accumulated Depreciation - O. E. 2012 10 -130988.62000 0.00000 22996.91000 -22996.91000 -153985.53000
Accumulated Depreciation - O. E. 2012 11 -153985.53000 0.00000 24616.50000 -24616.50000 -178602.03000
Accumulated Depreciation - O. E. 2012 12 -178602.03000 0.00000 24375.28000 -24375.28000 -202977.31000
Furniture and Fixtures 2012 0 0.00000 0.00000 0.00000 0.00000 135127.68000
Furniture and Fixtures 2012 1 135127.68000 809.00000 0.00000 809.00000 135936.68000
Furniture and Fixtures 2012 2 135936.68000 885.61000 0.00000 885.61000 136822.29000
Furniture and Fixtures 2012 3 136822.29000 2719.87000 0.00000 2719.87000 139542.16000
Furniture and Fixtures 2012 4 139542.16000 3994.00000 0.00000 3994.00000 143536.16000
Furniture and Fixtures 2012 5 143536.16000 420.70000 0.00000 420.70000 143956.86000
Furniture and Fixtures 2012 6 143956.86000 26456.80000 0.00000 26456.80000 170413.66000
Accumulated Depreciation - F & F 2012 0 0.00000 0.00000 0.00000 0.00000 -50951.15000
Accumulated Depreciation - F & F 2012 1 -50951.15000 0.00000 2790.58000 -2790.58000 -53741.73000
Accumulated Depreciation - F & F 2012 2 -53741.73000 0.00000 2809.07000 -2809.07000 -56550.80000
Accumulated Depreciation - F & F 2012 3 -56550.80000 0.00000 2865.71000 -2865.71000 -59416.51000
Accumulated Depreciation - F & F 2012 4 -59416.51000 0.00000 2948.91000 -2948.91000 -62365.42000
Accumulated Depreciation - F & F 2012 5 -62365.42000 0.00000 2955.53000 -2955.53000 -65320.95000
Accumulated Depreciation - F & F 2012 6 -65320.95000 0.00000 2848.02000 -2848.02000 -68168.97000
Accumulated Depreciation - F & F 2012 7 -68168.97000 0.00000 2825.42000 -2825.42000 -70994.39000
Accumulated Depreciation - F & F 2012 8 -70994.39000 0.00000 2825.43000 -2825.43000 -73819.82000
Accumulated Depreciation - F & F 2012 9 -73819.82000 0.00000 2825.42000 -2825.42000 -76645.24000
Accumulated Depreciation - F & F 2012 10 -76645.24000 0.00000 2825.42000 -2825.42000 -79470.66000
Accumulated Depreciation - F & F 2012 11 -79470.66000 0.00000 2825.42000 -2825.42000 -82296.08000
Accumulated Depreciation - F & F 2012 12 -82296.08000 0.00000 2825.42000 -2825.42000 -85121.50000
Accounts Receivable 2012 0 0.00000 0.00000 0.00000 0.00000 779825.81000
Accounts Receivable 2012 1 779825.81000 362371.13000 488302.28000 -125931.15000 653894.66000
Accounts Receivable 2012 2 653894.66000 412854.87000 366134.28000 46720.59000 700615.25000
Accounts Receivable 2012 3 700615.25000 344871.79000 474290.45000 -129418.66000 571196.59000
Accounts Receivable 2012 4 571196.59000 490609.86000 357000.03000 133609.83000 704806.42000
Accounts Receivable 2012 5 704806.42000 403296.40000 328909.54000 74386.86000 779193.28000
Accounts Receivable 2012 6 779193.28000 597334.80000 261985.20000 335349.60000 1114542.88000
Accounts Receivable 2012 7 1114542.88000 561178.24000 603069.60000 -41891.36000 1072651.52000
Accounts Receivable 2012 8 1072651.52000 823075.72000 659822.62000 163253.10000 1235904.62000
Accounts Receivable 2012 9 1235904.62000 611824.74000 498236.99000 113587.75000 1349492.37000
Accounts Receivable 2012 10 1349492.37000 604416.26000 965782.02000 -361365.76000 988126.61000
Accounts Receivable 2012 11 988126.61000 517995.66000 516734.26000 1261.40000 989388.01000
Accounts Receivable 2012 12 989388.01000 463755.85000 427533.73000 36222.12000 1025610.13000
Inter-Co- HR LLC 3211 2012 0 0.00000 0.00000 0.00000 0.00000 -509927.64000
Inter-Co- HR LLC 3211 2012 1 -509927.64000 26370.55000 36450.09000 -10079.54000 -520007.18000
Inter-Co- HR LLC 3211 2012 2 -520007.18000 8410.00000 39054.32000 -30644.32000 -550651.50000
Inter-Co- HR LLC 3211 2012 3 -550651.50000 14472.97000 28065.72000 -13592.75000 -564244.25000
Inter-Co- HR LLC 3211 2012 4 -564244.25000 7550.00000 29550.47000 -22000.47000 -586244.72000
Inter-Co- HR LLC 3211 2012 5 -586244.72000 30757.44000 23869.70000 6887.74000 -579356.98000
Inter-Co- HR LLC 3211 2012 6 -579356.98000 14262.21000 22499.66000 -8237.45000 -587594.43000
Inter-Co- HR LLC 3211 2012 7 -587594.43000 20787.83000 131218.61000 -110430.78000 -698025.21000
Inter-Co- HR LLC 3211 2012 8 -698025.21000 10835.05000 56052.76000 -45217.71000 -743242.92000
Inter-Co- HR LLC 3211 2012 9 -743242.92000 8495.90000 52074.92000 -43579.02000 -786821.94000
Inter-Co- HR LLC 3211 2012 10 -786821.94000 9056.67000 54857.39000 -45800.72000 -832622.66000
Inter-Co- HR LLC 3211 2012 11 -832622.66000 26350.93000 45722.25000 -19371.32000 -851993.98000
Inter-Co- HR LLC 3211 2012 12 -851993.98000 49037.51000 46279.99000 2757.52000 -849236.46000
Inter-Co-HRUKH 3261 2012 0 0.00000 0.00000 0.00000 0.00000 1095256.86000
Inter-Co-HRUKH 3261 2012 7 1095256.86000 100.00000 0.00000 100.00000 1095356.86000
Inter-Co-HRUKH 3261 2012 8 1095356.86000 615667.00000 0.00000 615667.00000 1711023.86000
Inter-Co-HRUKH 3261 2012 9 1711023.86000 750.00000 0.00000 750.00000 1711773.86000
Inter-Co-HRUKH 3261 2012 10 1711773.86000 1000.00000 0.00000 1000.00000 1712773.86000
Inter-Co-HRUKH 3261 2012 12 1712773.86000 15532.19000 15532.19000 0.00000 1712773.86000
Prepaid Expenses 2012 0 0.00000 0.00000 0.00000 0.00000 64463.02000
Prepaid Expenses 2012 1 64463.02000 15257.25000 16991.65000 -1734.40000 62728.62000
Prepaid Expenses 2012 2 62728.62000 2989.00000 23770.16000 -20781.16000 41947.46000
Prepaid Expenses 2012 3 41947.46000 36709.46000 21029.39000 15680.07000 57627.53000
Prepaid Expenses 2012 4 57627.53000 13145.40000 16555.43000 -3410.03000 54217.50000
Prepaid Expenses 2012 5 54217.50000 55132.62000 23164.05000 31968.57000 86186.07000
Prepaid Expenses 2012 6 86186.07000 181153.72000 45161.27000 135992.45000 222178.52000
Prepaid Expenses 2012 7 222178.52000 108161.79000 183385.33000 -75223.54000 146954.98000
Prepaid Expenses 2012 8 146954.98000 36829.52000 116486.77000 -79657.25000 67297.73000
Prepaid Expenses 2012 9 67297.73000 14143.67000 20020.32000 -5876.65000 61421.08000
Prepaid Expenses 2012 10 61421.08000 3369.56000 24331.54000 -20961.98000 40459.10000
Prepaid Expenses 2012 11 40459.10000 87967.00000 15873.29000 72093.71000 112552.81000
Prepaid Expenses 2012 12 112552.81000 50135.91000 23206.19000 26929.72000 139482.53000
Cash - HSBC#41503987 2012 0 0.00000 0.00000 0.00000 0.00000 234347.15000
Cash - HSBC#41503987 2012 1 234347.15000 861961.66000 524823.62000 337138.04000 571485.19000
Cash - HSBC#41503987 2012 2 571485.19000 349686.08000 295087.69000 54598.39000 626083.58000
Cash - HSBC#41503987 2012 3 626083.58000 458420.45000 443881.86000 14538.59000 640622.17000
Cash - HSBC#41503987 2012 4 640622.17000 343264.31000 366215.25000 -22950.94000 617671.23000
Cash - HSBC#41503987 2012 5 617671.23000 302526.01000 288689.95000 13836.06000 631507.29000
Cash - HSBC#41503987 2012 6 631507.29000 272580.26000 523368.98000 -250788.72000 380718.57000
Cash - HSBC#41503987 2012 7 380718.57000 922936.68000 394352.21000 528584.47000 909303.04000
Cash - HSBC#41503987 2012 8 909303.04000 642118.69000 527775.96000 114342.73000 1023645.77000
Cash - HSBC#41503987 2012 9 1023645.77000 474079.25000 918701.81000 -444622.56000 579023.21000
Cash - HSBC#41503987 2012 10 579023.21000 937909.29000 709634.52000 228274.77000 807297.98000
Cash - HSBC#41503987 2012 11 807297.98000 499764.11000 496683.82000 3080.29000 810378.27000
Cash - HSBC#41503987 2012 12 810378.27000 436940.91000 466420.73000 -29479.82000 780898.45000
Cash - HSBC#93663507 2012 0 0.00000 0.00000 0.00000 0.00000 83669.28000
Cash - HSBC#93663507 2012 1 83669.28000 272260.00000 122290.57000 149969.43000 233638.71000
Cash - HSBC#93663507 2012 2 233638.71000 53000.00000 195193.92000 -142193.92000 91444.79000
Cash - HSBC#93663507 2012 3 91444.79000 87000.00000 53323.92000 33676.08000 125120.87000
Cash - HSBC#93663507 2012 4 125120.87000 138000.00000 177252.26000 -39252.26000 85868.61000
Cash - HSBC#93663507 2012 5 85868.61000 24000.00000 105058.04000 -81058.04000 4810.57000
Cash - HSBC#93663507 2012 6 4810.57000 0.00000 3.78000 -3.78000 4806.79000
Cash - HSBC#93663507 2012 9 4806.79000 0.00000 5.00000 -5.00000 4801.79000
Cash - HSBC#93663507 2012 10 4801.79000 0.00000 5.00000 -5.00000 4796.79000
Cash - HSBC#93663507 2012 11 4796.79000 0.00000 5.00000 -5.00000 4791.79000
Cash - HSBC#93663507 2012 12 4791.79000 0.00000 4791.79000 -4791.79000 0.00000
Cash - HSBCUSD#69853491 2012 0 0.00000 0.00000 0.00000 0.00000 14549.36000
Cash - HSBCUSD#69853491 2012 1 14549.36000 0.00000 3.39000 -3.39000 14545.97000
Cash - HSBCUSD#69853491 2012 2 14545.97000 1714.58000 2.97000 1711.61000 16257.58000
Cash - HSBCUSD#69853491 2012 3 16257.58000 0.00000 3.17000 -3.17000 16254.41000
Cash - HSBCUSD#69853491 2012 4 16254.41000 0.00000 3.15000 -3.15000 16251.26000
Cash - HSBCUSD#69853491 2012 5 16251.26000 8063.00000 156.26000 7906.74000 24158.00000
Cash - HSBCUSD#69853491 2012 6 24158.00000 0.00000 3.15000 -3.15000 24154.85000
Cash - HSBCUSD#69853491 2012 7 24154.85000 0.00000 3.37000 -3.37000 24151.48000
Cash - HSBCUSD#69853491 2012 8 24151.48000 366.36000 600.50000 -234.14000 23917.34000
Cash - HSBCUSD#69853491 2012 9 23917.34000 0.00000 1595.00000 -1595.00000 22322.34000
Cash - HSBCUSD#69853491 2012 10 22322.34000 11480.61000 1281.57000 10199.04000 32521.38000
Cash - HSBCUSD#69853491 2012 11 32521.38000 483.99000 1299.11000 -815.12000 31706.26000
Cash - HSBCUSD#69853491 2012 12 31706.26000 0.00000 899.93000 -899.93000 30806.33000
Accounts Payable 2012 0 0.00000 0.00000 0.00000 0.00000 -111412.41000
Accounts Payable 2012 1 -111412.41000 115715.53000 101657.33000 14058.20000 -97354.21000
Accounts Payable 2012 2 -97354.21000 127015.41000 111461.45000 15553.96000 -81800.25000
Accounts Payable 2012 3 -81800.25000 202889.73000 193095.05000 9794.68000 -72005.57000
Accounts Payable 2012 4 -72005.57000 98356.61000 113193.59000 -14836.98000 -86842.55000
Accounts Payable 2012 5 -86842.55000 121441.83000 202386.49000 -80944.66000 -167787.21000
Accounts Payable 2012 6 -167787.21000 294579.16000 254669.51000 39909.65000 -127877.56000
Accounts Payable 2012 7 -127877.56000 141624.64000 197415.39000 -55790.75000 -183668.31000
Accounts Payable 2012 8 -183668.31000 234416.84000 1033594.21000 -799177.37000 -982845.68000
Accounts Payable 2012 9 -982845.68000 1028994.10000 230467.12000 798526.98000 -184318.70000
Accounts Payable 2012 10 -184318.70000 231716.79000 161643.96000 70072.83000 -114245.87000
Accounts Payable 2012 11 -114245.87000 163198.44000 232792.39000 -69593.95000 -183839.82000
Accounts Payable 2012 12 -183839.82000 223508.52000 309410.56000 -85902.04000 -269741.86000
Client Prepayments/Deposits 2012 0 0.00000 0.00000 0.00000 0.00000 -14149.42000
Client Prepayments/Deposits 2012 1 -14149.42000 7297.90000 1759.20000 5538.70000 -8610.72000
Client Prepayments/Deposits 2012 2 -8610.72000 1451.25000 552.00000 899.25000 -7711.47000
Client Prepayments/Deposits 2012 3 -7711.47000 3793.25000 0.00000 3793.25000 -3918.22000
Client Prepayments/Deposits 2012 4 -3918.22000 3894.22000 46544.00000 -42649.78000 -46568.00000
Client Prepayments/Deposits 2012 5 -46568.00000 474.00000 0.00000 474.00000 -46094.00000
Client Prepayments/Deposits 2012 7 -46094.00000 46070.00000 1805.00000 44265.00000 -1829.00000
Client Prepayments/Deposits 2012 8 -1829.00000 0.00000 3248.96000 -3248.96000 -5077.96000
Client Prepayments/Deposits 2012 9 -5077.96000 0.00000 349.00000 -349.00000 -5426.96000
Client Prepayments/Deposits 2012 10 -5426.96000 1116.96000 2214.00000 -1097.04000 -6524.00000
Client Prepayments/Deposits 2012 11 -6524.00000 0.00000 110.00000 -110.00000 -6634.00000
Accrued Liabilities - General 2012 0 0.00000 0.00000 0.00000 0.00000 -396749.83000
Accrued Liabilities - General 2012 1 -396749.83000 758.25000 21586.84000 -20828.59000 -417578.42000
Accrued Liabilities - General 2012 2 -417578.42000 43306.01000 17715.84000 25590.17000 -391988.25000
Accrued Liabilities - General 2012 3 -391988.25000 114201.52000 39671.84000 74529.68000 -317458.57000
Accrued Liabilities - General 2012 4 -317458.57000 8731.17000 35732.88000 -27001.71000 -344460.28000
Accrued Liabilities - General 2012 5 -344460.28000 48683.88000 28718.61000 19965.27000 -324495.01000
Accrued Liabilities - General 2012 6 -324495.01000 11517.30000 46266.85000 -34749.55000 -359244.56000
Accrued Liabilities - General 2012 7 -359244.56000 55570.96000 28361.65000 27209.31000 -332035.25000
Accrued Liabilities - General 2012 8 -332035.25000 62270.83000 90726.55000 -28455.72000 -360490.97000
Accrued Liabilities - General 2012 9 -360490.97000 126627.06000 35853.00000 90774.06000 -269716.91000
Accrued Liabilities - General 2012 10 -269716.91000 16950.00000 35680.00000 -18730.00000 -288446.91000
Accrued Liabilities - General 2012 11 -288446.91000 23010.84000 147152.80000 -124141.96000 -412588.87000
Accrued Liabilities - General 2012 12 -412588.87000 196747.47000 100600.18000 96147.29000 -316441.58000
Taxation - PAYE 2012 0 0.00000 0.00000 0.00000 0.00000 -53540.74000
Taxation - PAYE 2012 1 -53540.74000 53540.74000 51956.57000 1584.17000 -51956.57000
Taxation - PAYE 2012 2 -51956.57000 51956.57000 52654.24000 -697.67000 -52654.24000
Taxation - PAYE 2012 3 -52654.24000 52654.24000 86411.79000 -33757.55000 -86411.79000
Taxation - PAYE 2012 4 -86411.79000 86411.79000 57675.67000 28736.12000 -57675.67000
Taxation - PAYE 2012 5 -57675.67000 57675.67000 61806.92000 -4131.25000 -61806.92000
Taxation - PAYE 2012 6 -61806.92000 64381.68000 64503.10000 -121.42000 -61928.34000
Taxation - PAYE 2012 7 -61928.34000 61928.34000 65103.04000 -3174.70000 -65103.04000
Taxation - PAYE 2012 8 -65103.04000 65103.04000 65220.58000 -117.54000 -65220.58000
Taxation - PAYE 2012 9 -65220.58000 65220.58000 97970.50000 -32749.92000 -97970.50000
Taxation - PAYE 2012 10 -97970.50000 97970.50000 65665.77000 32304.73000 -65665.77000
Taxation - PAYE 2012 11 -65665.77000 65665.77000 55129.44000 10536.33000 -55129.44000
Taxation - PAYE 2012 12 -55129.44000 110258.88000 103073.85000 7185.03000 -47944.41000
Accrued Liabilities - VAT Control 2012 0 0.00000 0.00000 0.00000 0.00000 -196937.28000
Accrued Liabilities - VAT Control 2012 1 -196937.28000 66390.16000 55095.43000 11294.73000 -185642.55000
Accrued Liabilities - VAT Control 2012 2 -185642.55000 141601.86000 61369.54000 80232.32000 -105410.23000
Accrued Liabilities - VAT Control 2012 3 -105410.23000 20242.64000 51589.82000 -31347.18000 -136757.41000
Accrued Liabilities - VAT Control 2012 4 -136757.41000 98724.89000 76626.12000 22098.77000 -114658.64000
Accrued Liabilities - VAT Control 2012 5 -114658.64000 68911.37000 62099.54000 6811.83000 -107846.81000
Accrued Liabilities - VAT Control 2012 6 -107846.81000 134360.58000 91102.65000 43257.93000 -64588.88000
Accrued Liabilities - VAT Control 2012 7 -64588.88000 16147.98000 87006.09000 -70858.11000 -135446.99000
Accrued Liabilities - VAT Control 2012 8 -135446.99000 95301.43000 126920.00000 -31618.57000 -167065.56000
Accrued Liabilities - VAT Control 2012 9 -167065.56000 24045.30000 93111.06000 -69065.76000 -236131.32000
Accrued Liabilities - VAT Control 2012 10 -236131.32000 138985.10000 90597.81000 48387.29000 -187744.03000
Accrued Liabilities - VAT Control 2012 11 -187744.03000 143546.40000 78073.40000 65473.00000 -122271.03000
Accrued Liabilities - VAT Control 2012 12 -122271.03000 34777.77000 82616.61000 -47838.84000 -170109.87000
Paid in Capital 2012 0 0.00000 0.00000 0.00000 0.00000 -4086696.33000
Retained Earnings 2012 0 0.00000 0.00000 0.00000 0.00000 126224.68000
Retained Earnings 2012 12 126224.68000 28172.44000 32565.16000 -4392.72000 121831.96000
Accumulated Amortization - Intangible Asset 2012 0 0.00000 0.00000 0.00000 0.00000 -223586.85000
Accumulated Amortization - Intangible Asset 2012 1 -223586.85000 0.00000 14905.79000 -14905.79000 -238492.64000
Accumulated Amortization - Intangible Asset 2012 2 -238492.64000 0.00000 14905.79000 -14905.79000 -253398.43000
Accumulated Amortization - Intangible Asset 2012 3 -253398.43000 0.00000 14905.79000 -14905.79000 -268304.22000
Accumulated Amortization - Intangible Asset 2012 4 -268304.22000 0.00000 14905.79000 -14905.79000 -283210.01000
Accumulated Amortization - Intangible Asset 2012 5 -283210.01000 0.00000 14905.79000 -14905.79000 -298115.80000
Accumulated Amortization - Intangible Asset 2012 6 -298115.80000 0.00000 14905.79000 -14905.79000 -313021.59000
Accumulated Amortization - Intangible Asset 2012 7 -313021.59000 0.00000 14905.79000 -14905.79000 -327927.38000
Accumulated Amortization - Intangible Asset 2012 8 -327927.38000 0.00000 14905.79000 -14905.79000 -342833.17000
Accumulated Amortization - Intangible Asset 2012 9 -342833.17000 0.00000 14905.79000 -14905.79000 -357738.96000
Accumulated Amortization - Intangible Asset 2012 10 -357738.96000 0.00000 14905.79000 -14905.79000 -372644.75000
Accumulated Amortization - Intangible Asset 2012 11 -372644.75000 0.00000 14905.79000 -14905.79000 -387550.54000
Accumulated Amortization - Intangible Asset 2012 12 -387550.54000 0.00000 14905.79000 -14905.79000 -402456.33000
Goodwill 2012 0 0.00000 0.00000 0.00000 0.00000 1746505.91000
Intangible Asset 2012 0 0.00000 0.00000 0.00000 0.00000 1788694.66000
Cumulative Translation Adjustments 2012 0 0.00000 0.00000 0.00000 0.00000 -44072.73000
Cumulative Translation Adjustments 2012 1 -44072.73000 115.24000 17963.07000 -17847.83000 -61920.56000
Cumulative Translation Adjustments 2012 2 -61920.56000 18260.52000 0.00000 18260.52000 -43660.04000
Cumulative Translation Adjustments 2012 3 -43660.04000 0.00000 6354.90000 -6354.90000 -50014.94000
Cumulative Translation Adjustments 2012 4 -50014.94000 599.21000 6.96000 592.25000 -49422.69000
Cumulative Translation Adjustments 2012 5 -49422.69000 0.00000 5727.92000 -5727.92000 -55150.61000
Cumulative Translation Adjustments 2012 6 -55150.61000 0.00000 5737.09000 -5737.09000 -60887.70000
Cumulative Translation Adjustments 2012 7 -60887.70000 0.00000 11095.86000 -11095.86000 -71983.56000
Cumulative Translation Adjustments 2012 8 -71983.56000 20828.31000 0.00000 20828.31000 -51155.25000
Cumulative Translation Adjustments 2012 9 -51155.25000 20559.12000 0.00000 20559.12000 -30596.13000
Cumulative Translation Adjustments 2012 10 -30596.13000 4676.23000 0.00000 4676.23000 -25919.90000
Cumulative Translation Adjustments 2012 11 -25919.90000 491.81000 18219.85000 -17728.04000 -43647.94000
Cumulative Translation Adjustments 2012 12 -43647.94000 16763.97000 43517.63000 -26753.66000 -70401.60000
Inter-Co-KBA ("US") 4504 2012 0 0.00000 0.00000 0.00000 0.00000 -646.68000
Inter-Co-KBA ("US") 4504 2012 1 -646.68000 21.52000 0.00000 21.52000 -625.16000
Inter-Co-KBA ("US") 4504 2012 2 -625.16000 0.00000 22.11000 -22.11000 -647.27000
Inter-Co-KBA ("US") 4504 2012 3 -647.27000 7.20000 0.00000 7.20000 -640.07000
Inter-Co-KBA ("US") 4504 2012 4 -640.07000 0.00000 0.82000 -0.82000 -640.89000
Inter-Co-KBA ("US") 4504 2012 5 -640.89000 5.36000 0.00000 5.36000 -635.53000
Inter-Co-KBA ("US") 4504 2012 6 -635.53000 5.61000 0.00000 5.61000 -629.92000
Inter-Co-KBA ("US") 4504 2012 7 -629.92000 10.14000 0.00000 10.14000 -619.78000
Inter-Co-KBA ("US") 4504 2012 8 -619.78000 0.00000 18.46000 -18.46000 -638.24000
Inter-Co-KBA ("US") 4504 2012 9 -638.24000 638.24000 0.00000 638.24000 0.00000
Inter-Co-HR Ltd 4501 2012 0 0.00000 0.00000 0.00000 0.00000 42194.34000
Inter-Co-HR Ltd 4501 2012 1 42194.34000 366.00000 350115.24000 -349749.24000 -307554.90000
Inter-Co-HR Ltd 4501 2012 2 -307554.90000 305.10000 149.10000 156.00000 -307398.90000
Inter-Co-HR Ltd 4501 2012 4 -307398.90000 0.00000 5450.00000 -5450.00000 -312848.90000
Inter-Co-HR Ltd 4501 2012 5 -312848.90000 205.40000 9600.00000 -9394.60000 -322243.50000
Inter-Co-HR Ltd 4501 2012 6 -322243.50000 3040.25000 229919.86000 -226879.61000 -549123.11000
Inter-Co-HR Ltd 4501 2012 7 -549123.11000 18001.42000 348457.85000 -330456.43000 -879579.54000
Inter-Co-HR Ltd 4501 2012 8 -879579.54000 34621.91000 646385.00000 -611763.09000 -1491342.63000
Inter-Co-HR Ltd 4501 2012 9 -1491342.63000 324873.88000 832021.66000 -507147.78000 -1998490.41000
Inter-Co-HR Ltd 4501 2012 10 -1998490.41000 124018.15000 10615.19000 113402.96000 -1885087.45000
Inter-Co-HR Ltd 4501 2012 11 -1885087.45000 43067.98000 7810.00000 35257.98000 -1849829.47000
Inter-Co-HR Ltd 4501 2012 12 -1849829.47000 27376.42000 6035.63000 21340.79000 -1828488.68000
Corporation Tax Payable 2012 0 0.00000 0.00000 0.00000 0.00000 -104110.00000
Corporation Tax Payable 2012 4 -104110.00000 0.00000 24589.44000 -24589.44000 -128699.44000
Corporation Tax Payable 2012 7 -128699.44000 202.00000 11500.00000 -11298.00000 -139997.44000
Corporation Tax Payable 2012 8 -139997.44000 30087.44000 24589.44000 5498.00000 -134499.44000
Corporation Tax Payable 2012 9 -134499.44000 134470.44000 0.00000 134470.44000 -29.00000
Corporation Tax Payable 2012 12 -29.00000 24643.44000 35604.44000 -10961.00000 -10990.00000
Allowance for Bad Debt 2012 1 0.00000 2676.00000 13918.80000 -11242.80000 -11242.80000
Allowance for Bad Debt 2012 2 -11242.80000 0.00000 2340.00000 -2340.00000 -13582.80000
Allowance for Bad Debt 2012 3 -13582.80000 967.20000 9043.20000 -8076.00000 -21658.80000
Allowance for Bad Debt 2012 4 -21658.80000 1330.80000 0.00000 1330.80000 -20328.00000
Allowance for Bad Debt 2012 5 -20328.00000 7772.40000 8786.40000 -1014.00000 -21342.00000
Allowance for Bad Debt 2012 6 -21342.00000 0.00000 16174.80000 -16174.80000 -37516.80000
Allowance for Bad Debt 2012 7 -37516.80000 16132.80000 276.00000 15856.80000 -21660.00000
Allowance for Bad Debt 2012 8 -21660.00000 30.00000 558.00000 -528.00000 -22188.00000
Allowance for Bad Debt 2012 9 -22188.00000 0.00000 626.44000 -626.44000 -22814.44000
Allowance for Bad Debt 2012 12 -22814.44000 22814.44000 0.00000 22814.44000 0.00000
Def Tax Payable - ST 2012 0 0.00000 0.00000 0.00000 0.00000 -33276.00000
Revalue F&F - Puchase Adj 2012 0 0.00000 0.00000 0.00000 0.00000 -21513.00000
Revalue Off Equip Purchase Adj 2012 0 0.00000 0.00000 0.00000 0.00000 -37596.00000
Revalue F&F Accum Dep-Purch Adj 2012 0 0.00000 0.00000 0.00000 0.00000 21513.00000
Revalue OE Accum Deprec-Purchase Adj 2012 0 0.00000 0.00000 0.00000 0.00000 37596.00000
Common Stock 2012 0 0.00000 0.00000 0.00000 0.00000 0.00000
Deferred Tax Payable - LT 2012 0 0.00000 0.00000 0.00000 0.00000 -424553.00000
Deferred Tax Payable - LT 2012 7 -424553.00000 72235.00000 0.00000 72235.00000 -352318.00000
Deferred Tax Payable - LT 2012 9 -352318.00000 0.00000 11371.00000 -11371.00000 -363689.00000
Deferred Tax Payable - LT 2012 12 -363689.00000 0.00000 1110.00000 -1110.00000 -364799.00000
Cash - HSBC Euro#71687592 2012 4 0.00000 2231.00000 0.00000 2231.00000 2231.00000
Cash - HSBC Euro#71687592 2012 5 2231.00000 1262.34000 1.32000 1261.02000 3492.02000
Cash - HSBC Euro#71687592 2012 6 3492.02000 348.00000 5.03000 342.97000 3834.99000
Cash - HSBC Euro#71687592 2012 7 3834.99000 2896.00000 5.26000 2890.74000 6725.73000
Cash - HSBC Euro#71687592 2012 8 6725.73000 4301.14000 5.04000 4296.10000 11021.83000
Cash - HSBC Euro#71687592 2012 9 11021.83000 7107.51000 5.33000 7102.18000 18124.01000
Cash - HSBC Euro#71687592 2012 10 18124.01000 954.67000 202.47000 752.20000 18876.21000
Cash - HSBC Euro#71687592 2012 11 18876.21000 2198.94000 6.62000 2192.32000 21068.53000
Cash - HSBC Euro#71687592 2012 12 21068.53000 2341.66000 3571.35000 -1229.69000 19838.84000
Inter-Co-HR Solutions, Inc 3210 2012 2 0.00000 0.00000 37527.01000 -37527.01000 -37527.01000
Inter-Co-HR Solutions, Inc 3210 2012 12 -37527.01000 37527.01000 0.00000 37527.01000 0.00000
Inter-Co-KO (US) 4225 2012 3 0.00000 4.73000 6052.59000 -6047.86000 -6047.86000
Inter-Co-KO (US) 4225 2012 4 -6047.86000 6.96000 1710.50000 -1703.54000 -7751.40000
Inter-Co-KO (US) 4225 2012 5 -7751.40000 47.12000 4672.63000 -4625.51000 -12376.91000
Inter-Co-KO (US) 4225 2012 6 -12376.91000 126.27000 3824.40000 -3698.13000 -16075.04000
Inter-Co-KO (US) 4225 2012 7 -16075.04000 299.89000 3787.11000 -3487.22000 -19562.26000
Inter-Co-KO (US) 4225 2012 8 -19562.26000 0.00000 1871.07000 -1871.07000 -21433.33000
Inter-Co-KO (US) 4225 2012 9 -21433.33000 0.00000 1402.34000 -1402.34000 -22835.67000
Inter-Co-KO (US) 4225 2012 10 -22835.67000 0.00000 1434.01000 -1434.01000 -24269.68000
Inter-Co-KO (US) 4225 2012 11 -24269.68000 983.62000 1778.18000 -794.56000 -25064.24000
Inter-Co-KO (US) 4225 2012 12 -25064.24000 630.62000 1255.99000 -625.37000 -25689.61000
Inter-Co-KO Legal Tech 4213 2012 8 0.00000 0.00000 8136.75000 -8136.75000 -8136.75000
Inter-Co-KO Legal Tech 4213 2012 11 -8136.75000 8136.75000 0.00000 8136.75000 0.00000
Petty cash 2012 10 0.00000 600.00000 0.00000 600.00000 600.00000
Petty cash 2012 11 600.00000 119.50000 0.00000 119.50000 719.50000
Petty cash 2012 12 719.50000 0.00000 119.50000 -119.50000 600.00000
Employee Advances 2012 10 0.00000 8456.15000 1632.25000 6823.90000 6823.90000
Employee Advances 2012 11 6823.90000 411.86000 2313.15000 -1901.29000 4922.61000
Employee Advances 2012 12 4922.61000 0.00000 943.89000 -943.89000 3978.72000
FA : Computer Software 2012 12 0.00000 5177.69000 0.00000 5177.69000 5177.69000
Acc Dep : Computer Software 2012 12 0.00000 0.00000 215.74000 -215.74000 -215.74000
Operations-Direct-Information/Data Costs 2012 1 0.00000 72947.00000 87.00000 72860.00000 72860.00000
Operations-Direct-Information/Data Costs 2012 2 72860.00000 94132.65000 5808.32000 88324.33000 161184.33000
Operations-Direct-Information/Data Costs 2012 3 161184.33000 81909.50000 5700.00000 76209.50000 237393.83000
Operations-Direct-Information/Data Costs 2012 4 237393.83000 85775.90000 6636.33000 79139.57000 316533.40000
Operations-Direct-Information/Data Costs 2012 5 316533.40000 90093.30000 17292.18000 72801.12000 389334.52000
Operations-Direct-Information/Data Costs 2012 6 389334.52000 287719.47000 168078.13000 119641.34000 508975.86000
Operations-Direct-Information/Data Costs 2012 7 508975.86000 129384.01000 19303.00000 110081.01000 619056.87000
Operations-Direct-Information/Data Costs 2012 8 619056.87000 150424.86000 0.00000 150424.86000 769481.73000
Operations-Direct-Information/Data Costs 2012 9 769481.73000 174578.73000 45894.01000 128684.72000 898166.45000
Operations-Direct-Information/Data Costs 2012 10 898166.45000 130645.85000 126.98000 130518.87000 1028685.32000
Operations-Direct-Information/Data Costs 2012 11 1028685.32000 130766.03000 19184.70000 111581.33000 1140266.65000
Operations-Direct-Information/Data Costs 2012 12 1140266.65000 147491.69000 48853.26000 98638.43000 1238905.08000
Operations-Direct-Salaries 2012 1 0.00000 125628.15000 0.00000 125628.15000 125628.15000
Operations-Direct-Salaries 2012 2 125628.15000 117962.12000 2916.67000 115045.45000 240673.60000
Operations-Direct-Salaries 2012 3 240673.60000 125993.40000 0.00000 125993.40000 366667.00000
Operations-Direct-Salaries 2012 4 366667.00000 145712.90000 3902.56000 141810.34000 508477.34000
Operations-Direct-Salaries 2012 5 508477.34000 148836.44000 0.00000 148836.44000 657313.78000
Operations-Direct-Salaries 2012 6 657313.78000 167302.54000 3106.31000 164196.23000 821510.01000
Operations-Direct-Salaries 2012 7 821510.01000 233878.36000 99009.93000 134868.43000 956378.44000
Operations-Direct-Salaries 2012 8 956378.44000 153527.61000 7103.21000 146424.40000 1102802.84000
Operations-Direct-Salaries 2012 9 1102802.84000 142439.05000 0.00000 142439.05000 1245241.89000
Operations-Direct-Salaries 2012 10 1245241.89000 163400.40000 0.00000 163400.40000 1408642.29000
Operations-Direct-Salaries 2012 11 1408642.29000 140343.89000 11219.86000 129124.03000 1537766.32000
Operations-Direct-Salaries 2012 12 1537766.32000 135515.32000 0.00000 135515.32000 1673281.64000
Operations-Direct-Overtime 2012 6 0.00000 8084.65000 147.78000 7936.87000 7936.87000
Operations-Direct-Overtime 2012 7 7936.87000 11491.06000 2474.59000 9016.47000 16953.34000
Operations-Direct-Overtime 2012 8 16953.34000 9376.14000 0.00000 9376.14000 26329.48000
Operations-Direct-Overtime 2012 9 26329.48000 9676.65000 0.00000 9676.65000 36006.13000
Operations-Direct-Overtime 2012 10 36006.13000 10115.40000 0.00000 10115.40000 46121.53000
Operations-Direct-Overtime 2012 11 46121.53000 4483.88000 123.85000 4360.03000 50481.56000
Operations-Direct-Overtime 2012 12 50481.56000 1361.97000 0.00000 1361.97000 51843.53000
Operations-Direct-Bonus Expense 2012 1 0.00000 750.00000 0.00000 750.00000 750.00000
Operations-Direct-Bonus Expense 2012 2 750.00000 1500.00000 0.00000 1500.00000 2250.00000
Operations-Direct-Bonus Expense 2012 3 2250.00000 2778.36000 0.00000 2778.36000 5028.36000
Operations-Direct-Bonus Expense 2012 4 5028.36000 1692.71000 0.00000 1692.71000 6721.07000
Operations-Direct-Bonus Expense 2012 5 6721.07000 3223.90000 0.00000 3223.90000 9944.97000
Operations-Direct-Bonus Expense 2012 6 9944.97000 2554.31000 0.00000 2554.31000 12499.28000
Operations-Direct-Bonus Expense 2012 7 12499.28000 0.00000 4726.71000 -4726.71000 7772.57000
Operations-Direct-Bonus Expense 2012 8 7772.57000 311.95000 0.00000 311.95000 8084.52000
Operations-Direct-Bonus Expense 2012 9 8084.52000 303.16000 0.00000 303.16000 8387.68000
Operations-Direct-Bonus Expense 2012 10 8387.68000 882.07000 0.00000 882.07000 9269.75000
Operations-Direct-Bonus Expense 2012 11 9269.75000 1836.56000 0.00000 1836.56000 11106.31000
Operations-Direct-Bonus Expense 2012 12 11106.31000 239.89000 0.00000 239.89000 11346.20000
Operations-Direct-Holiday 2012 1 0.00000 619.24000 0.00000 619.24000 619.24000
Operations-Direct-Holiday 2012 2 619.24000 380.75000 0.00000 380.75000 999.99000
Operations-Direct-Holiday 2012 3 999.99000 351.90000 0.00000 351.90000 1351.89000
Operations-Direct-Holiday 2012 4 1351.89000 115.38000 0.00000 115.38000 1467.27000
Operations-Direct-Holiday 2012 5 1467.27000 126.92000 0.00000 126.92000 1594.19000
Operations-Direct-Holiday 2012 6 1594.19000 283.66000 269.23000 14.43000 1608.62000
Operations-Direct-Holiday 2012 7 1608.62000 134.62000 0.00000 134.62000 1743.24000
Operations-Direct-Holiday 2012 8 1743.24000 403.88000 0.00000 403.88000 2147.12000
Operations-Direct-Holiday 2012 9 2147.12000 242.32000 0.00000 242.32000 2389.44000
Operations-Direct-Holiday 2012 11 2389.44000 153.87000 0.00000 153.87000 2543.31000
Operations-Direct-Holiday 2012 12 2543.31000 990.36000 0.00000 990.36000 3533.67000
Operations-Direct-ER Payroll Taxes 2012 1 0.00000 9354.51000 0.00000 9354.51000 9354.51000
Operations-Direct-ER Payroll Taxes 2012 2 9354.51000 9234.16000 794.94000 8439.22000 17793.73000
Operations-Direct-ER Payroll Taxes 2012 3 17793.73000 10579.67000 1049.17000 9530.50000 27324.23000
Operations-Direct-ER Payroll Taxes 2012 4 27324.23000 11497.54000 1513.38000 9984.16000 37308.39000
Operations-Direct-ER Payroll Taxes 2012 5 37308.39000 12057.80000 936.74000 11121.06000 48429.45000
Operations-Direct-ER Payroll Taxes 2012 6 48429.45000 13451.37000 1162.55000 12288.82000 60718.27000
Operations-Direct-ER Payroll Taxes 2012 7 60718.27000 14858.58000 6316.12000 8542.46000 69260.73000
Operations-Direct-ER Payroll Taxes 2012 8 69260.73000 12121.09000 2631.11000 9489.98000 78750.71000
Operations-Direct-ER Payroll Taxes 2012 9 78750.71000 11423.12000 1782.03000 9641.09000 88391.80000
Operations-Direct-ER Payroll Taxes 2012 10 88391.80000 12771.26000 1824.91000 10946.35000 99338.15000
Operations-Direct-ER Payroll Taxes 2012 11 99338.15000 10374.89000 2902.95000 7471.94000 106810.09000
Operations-Direct-ER Payroll Taxes 2012 12 106810.09000 9893.41000 5485.93000 4407.48000 111217.57000
Operations-Direct-Contract Labor 2012 7 0.00000 61134.60000 0.00000 61134.60000 61134.60000
Operations-Direct-Contract Labor 2012 8 61134.60000 39467.45000 8227.80000 31239.65000 92374.25000
Operations-Direct-Contract Labor 2012 9 92374.25000 24434.41000 5027.40000 19407.01000 111781.26000
Operations-Direct-Contract Labor 2012 10 111781.26000 5502.28000 5000.00000 502.28000 112283.54000
Operations-Direct-Postage 2012 1 0.00000 5.60000 5.60000 0.00000 0.00000
Operations-Direct-Telephone and Fax 2012 1 0.00000 2360.61000 2360.61000 0.00000 0.00000
Operations-Direct-Telephone and Fax 2012 2 0.00000 75.00000 75.00000 0.00000 0.00000
Operations-Direct-Rent-Office 2012 1 0.00000 12609.70000 0.00000 12609.70000 12609.70000
Operations-Direct-Rent-Office 2012 2 12609.70000 25323.40000 12661.70000 12661.70000 25271.40000
Operations-Direct-Rent-Office 2012 3 25271.40000 12635.69000 0.00000 12635.69000 37907.09000
Operations-Direct-Rent-Office 2012 4 37907.09000 13910.10000 0.00000 13910.10000 51817.19000
Operations-Direct-Rent-Office 2012 5 51817.19000 14444.70000 0.00000 14444.70000 66261.89000
Operations-Direct-Rent-Office 2012 6 66261.89000 13910.09000 0.00000 13910.09000 80171.98000
Operations-Direct-Rent-Office 2012 7 80171.98000 13910.10000 0.00000 13910.10000 94082.08000
Operations-Direct-Rent-Office 2012 8 94082.08000 13910.10000 0.00000 13910.10000 107992.18000
Operations-Direct-Rent-Office 2012 9 107992.18000 13910.10000 0.00000 13910.10000 121902.28000
Operations-Direct-Rent-Office 2012 10 121902.28000 13910.10000 0.00000 13910.10000 135812.38000
Operations-Direct-Rent-Office 2012 11 135812.38000 13910.10000 0.00000 13910.10000 149722.48000
Operations-Direct-Rent-Office 2012 12 149722.48000 13910.10000 0.00000 13910.10000 163632.58000
Operations-Direct-Recruiting/Placement Fees 2012 7 0.00000 15900.00000 0.00000 15900.00000 15900.00000
Operations-Direct-Recruiting/Placement Fees 2012 8 15900.00000 6000.00000 0.00000 6000.00000 21900.00000
Operations-Direct-Recruiting/Placement Fees 2012 9 21900.00000 5150.00000 0.00000 5150.00000 27050.00000
Operations-Direct-Recruiting/Placement Fees 2012 10 27050.00000 300.00000 0.00000 300.00000 27350.00000
Operations-Direct-Recruiting/Placement Fees 2012 11 27350.00000 1500.00000 0.00000 1500.00000 28850.00000
Bad Debt Expense 2012 1 0.00000 13918.80000 2676.00000 11242.80000 11242.80000
Bad Debt Expense 2012 2 11242.80000 2340.00000 0.00000 2340.00000 13582.80000
Bad Debt Expense 2012 3 13582.80000 9043.20000 967.20000 8076.00000 21658.80000
Bad Debt Expense 2012 4 21658.80000 0.00000 1330.80000 -1330.80000 20328.00000
Bad Debt Expense 2012 5 20328.00000 8786.40000 7772.40000 1014.00000 21342.00000
Bad Debt Expense 2012 6 21342.00000 16174.80000 0.00000 16174.80000 37516.80000
Bad Debt Expense 2012 7 37516.80000 276.00000 16132.80000 -15856.80000 21660.00000
Bad Debt Expense 2012 8 21660.00000 558.00000 922.80000 -364.80000 21295.20000
Bad Debt Expense 2012 9 21295.20000 626.44000 0.00000 626.44000 21921.64000
Bad Debt Expense 2012 10 21921.64000 0.00000 21921.64000 -21921.64000 0.00000
Salaries-Sales-EMEA 2012 1 0.00000 6666.67000 0.00000 6666.67000 6666.67000
Salaries-Sales-EMEA 2012 2 6666.67000 6666.67000 0.00000 6666.67000 13333.34000
Salaries-Sales-EMEA 2012 3 13333.34000 6666.67000 0.00000 6666.67000 20000.01000
Salaries-Sales-EMEA 2012 4 20000.01000 6800.00000 0.00000 6800.00000 26800.01000
Salaries-Sales-EMEA 2012 5 26800.01000 7427.69000 0.00000 7427.69000 34227.70000
Bonus-Sales-EMEA 2012 3 0.00000 6655.61000 0.00000 6655.61000 6655.61000
Bonus-Sales-EMEA 2012 4 6655.61000 816.34000 0.00000 816.34000 7471.95000
Bonus-Sales-EMEA 2012 5 7471.95000 1087.87000 0.00000 1087.87000 8559.82000
Bonus-Sales-EMEA 2012 6 8559.82000 1407.73000 0.00000 1407.73000 9967.55000
Bonus-Sales-EMEA 2012 7 9967.55000 0.00000 4576.45000 -4576.45000 5391.10000
Bonus-Sales-EMEA 2012 8 5391.10000 302.28000 0.00000 302.28000 5693.38000
Bonus-Sales-EMEA 2012 9 5693.38000 293.50000 0.00000 293.50000 5986.88000
Bonus-Sales-EMEA 2012 10 5986.88000 285.59000 0.00000 285.59000 6272.47000
Bonus-Sales-EMEA 2012 11 6272.47000 326.01000 0.00000 326.01000 6598.48000
Bonus-Sales-EMEA 2012 12 6598.48000 231.99000 0.00000 231.99000 6830.47000
ER Payroll Taxes-Sales-EMEA 2012 1 0.00000 838.71000 0.00000 838.71000 838.71000
ER Payroll Taxes-Sales-EMEA 2012 2 838.71000 838.71000 0.00000 838.71000 1677.42000
ER Payroll Taxes-Sales-EMEA 2012 3 1677.42000 1757.18000 0.00000 1757.18000 3434.60000
ER Payroll Taxes-Sales-EMEA 2012 4 3434.60000 969.77000 0.00000 969.77000 4404.37000
ER Payroll Taxes-Sales-EMEA 2012 5 4404.37000 1093.86000 0.00000 1093.86000 5498.23000
ER Payroll Taxes-Sales-EMEA 2012 6 5498.23000 194.27000 0.00000 194.27000 5692.50000
ER Payroll Taxes-Sales-EMEA 2012 7 5692.50000 0.00000 631.55000 -631.55000 5060.95000
ER Payroll Taxes-Sales-EMEA 2012 8 5060.95000 41.72000 0.00000 41.72000 5102.67000
ER Payroll Taxes-Sales-EMEA 2012 9 5102.67000 40.50000 0.00000 40.50000 5143.17000
ER Payroll Taxes-Sales-EMEA 2012 10 5143.17000 39.41000 0.00000 39.41000 5182.58000
ER Payroll Taxes-Sales-EMEA 2012 11 5182.58000 44.99000 0.00000 44.99000 5227.57000
ER Payroll Taxes-Sales-EMEA 2012 12 5227.57000 32.01000 0.00000 32.01000 5259.58000
Travel-Sales-EMEA 2012 4 0.00000 450.00000 0.00000 450.00000 450.00000
Travel-Subsistence-Sales-EMEA 2012 4 0.00000 450.00000 402.10000 47.90000 47.90000
Commissions-Acct Mgt-EMEA 2012 10 0.00000 1275.00000 0.00000 1275.00000 1275.00000
Salaries-Acct Mgt-EMEA 2012 1 0.00000 4166.67000 0.00000 4166.67000 4166.67000
Salaries-Acct Mgt-EMEA 2012 2 4166.67000 4166.67000 0.00000 4166.67000 8333.34000
Salaries-Acct Mgt-EMEA 2012 3 8333.34000 4166.67000 0.00000 4166.67000 12500.01000
Salaries-Acct Mgt-EMEA 2012 4 12500.01000 4166.67000 0.00000 4166.67000 16666.68000
Salaries-Acct Mgt-EMEA 2012 5 16666.68000 4166.67000 0.00000 4166.67000 20833.35000
Salaries-Acct Mgt-EMEA 2012 6 20833.35000 4166.67000 0.00000 4166.67000 25000.02000
Salaries-Acct Mgt-EMEA 2012 7 25000.02000 4166.67000 0.00000 4166.67000 29166.69000
Salaries-Acct Mgt-EMEA 2012 8 29166.69000 4166.67000 0.00000 4166.67000 33333.36000
Salaries-Acct Mgt-EMEA 2012 9 33333.36000 4166.67000 0.00000 4166.67000 37500.03000
Salaries-Acct Mgt-EMEA 2012 10 37500.03000 4166.67000 0.00000 4166.67000 41666.70000
Salaries-Acct Mgt-EMEA 2012 11 41666.70000 4166.67000 0.00000 4166.67000 45833.37000
Salaries-Acct Mgt-EMEA 2012 12 45833.37000 4166.67000 0.00000 4166.67000 50000.04000
Overtime-Acct Mgt-EMEA 2012 10 0.00000 717.92000 0.00000 717.92000 717.92000
Overtime-Acct Mgt-EMEA 2012 11 717.92000 0.00000 717.92000 -717.92000 0.00000
Bonus-Acct Mgt-EMEA 2012 6 0.00000 558.00000 0.00000 558.00000 558.00000
ER Payroll Taxes-Acct Mgt-EMEA 2012 1 0.00000 493.71000 0.00000 493.71000 493.71000
ER Payroll Taxes-Acct Mgt-EMEA 2012 2 493.71000 493.71000 0.00000 493.71000 987.42000
ER Payroll Taxes-Acct Mgt-EMEA 2012 3 987.42000 493.71000 0.00000 493.71000 1481.13000
ER Payroll Taxes-Acct Mgt-EMEA 2012 4 1481.13000 493.71000 0.00000 493.71000 1974.84000
ER Payroll Taxes-Acct Mgt-EMEA 2012 5 1974.84000 493.71000 0.00000 493.71000 2468.55000
ER Payroll Taxes-Acct Mgt-EMEA 2012 6 2468.55000 570.71000 0.00000 570.71000 3039.26000
ER Payroll Taxes-Acct Mgt-EMEA 2012 7 3039.26000 488.88000 0.00000 488.88000 3528.14000
ER Payroll Taxes-Acct Mgt-EMEA 2012 8 3528.14000 488.88000 0.00000 488.88000 4017.02000
ER Payroll Taxes-Acct Mgt-EMEA 2012 9 4017.02000 488.88000 0.00000 488.88000 4505.90000
ER Payroll Taxes-Acct Mgt-EMEA 2012 10 4505.90000 763.90000 0.00000 763.90000 5269.80000
ER Payroll Taxes-Acct Mgt-EMEA 2012 11 5269.80000 389.81000 0.00000 389.81000 5659.61000
ER Payroll Taxes-Acct Mgt-EMEA 2012 12 5659.61000 488.88000 0.00000 488.88000 6148.49000
Travel-Acct Mgt-EMEA 2012 4 0.00000 2.00000 0.00000 2.00000 2.00000
Travel-Acct Mgt-EMEA 2012 6 2.00000 7.00000 2.00000 5.00000 7.00000
Travel-Acct Mgt-EMEA 2012 11 7.00000 54.00000 0.00000 54.00000 61.00000
Travel-Acct Mgt-EMEA 2012 12 61.00000 2479.40000 0.00000 2479.40000 2540.40000
Travel-Subsistence-Acct Mgt-EMEA 2012 4 0.00000 3.79000 0.00000 3.79000 3.79000
Travel-Subsistence-Acct Mgt-EMEA 2012 10 3.79000 160.91000 0.00000 160.91000 164.70000
Travel-Subsistence-Acct Mgt-EMEA 2012 12 164.70000 136.70000 0.00000 136.70000 301.40000
Donations/Contributions-Mrkt'g-EMEA 2012 4 0.00000 20.00000 0.00000 20.00000 20.00000
Donations/Contributions-Mrkt'g-EMEA 2012 6 20.00000 237.09000 0.00000 237.09000 257.09000
Marketing-Mrkt'g-EMEA 2012 1 0.00000 285.00000 0.00000 285.00000 285.00000
Marketing-Mrkt'g-EMEA 2012 2 285.00000 2122.50000 285.00000 1837.50000 2122.50000
Marketing-Mrkt'g-EMEA 2012 4 2122.50000 327.88000 0.00000 327.88000 2450.38000
Marketing-Mrkt'g-EMEA 2012 6 2450.38000 9.89000 0.00000 9.89000 2460.27000
Marketing-Mrkt'g-EMEA 2012 7 2460.27000 6.90000 0.00000 6.90000 2467.17000
Marketing-Mrkt'g-EMEA 2012 8 2467.17000 9.89000 0.00000 9.89000 2477.06000
Marketing-Mrkt'g-EMEA 2012 9 2477.06000 10000.00000 0.00000 10000.00000 12477.06000
Marketing-Mrkt'g-EMEA 2012 10 12477.06000 87.12000 0.00000 87.12000 12564.18000
Marketing-Mrkt'g-EMEA 2012 11 12564.18000 1155.00000 0.00000 1155.00000 13719.18000
Marketing-Mrkt'g-EMEA 2012 12 13719.18000 41.74000 1155.00000 -1113.26000 12605.92000
Advertising-Mrkt'g-EMEA 2012 1 0.00000 608.18000 250.00000 358.18000 358.18000
Advertising-Mrkt'g-EMEA 2012 2 358.18000 207.04000 103.52000 103.52000 461.70000
Advertising-Mrkt'g-EMEA 2012 3 461.70000 621.45000 461.70000 159.75000 621.45000
Advertising-Mrkt'g-EMEA 2012 4 621.45000 97.52000 0.00000 97.52000 718.97000
Advertising-Mrkt'g-EMEA 2012 5 718.97000 105.94000 0.00000 105.94000 824.91000
Advertising-Mrkt'g-EMEA 2012 6 824.91000 106.99000 0.00000 106.99000 931.90000
Advertising-Mrkt'g-EMEA 2012 7 931.90000 109.34000 0.00000 109.34000 1041.24000
Advertising-Mrkt'g-EMEA 2012 8 1041.24000 111.39000 0.00000 111.39000 1152.63000
Advertising-Mrkt'g-EMEA 2012 9 1152.63000 97.52000 0.00000 97.52000 1250.15000
Advertising-Mrkt'g-EMEA 2012 10 1250.15000 107.78000 0.00000 107.78000 1357.93000
Advertising-Mrkt'g-EMEA 2012 11 1357.93000 112.90000 0.00000 112.90000 1470.83000
Advertising-Mrkt'g-EMEA 2012 12 1470.83000 103.73000 0.00000 103.73000 1574.56000
Salaries-Bus Dev-EMEA 2012 1 0.00000 9907.69000 0.00000 9907.69000 9907.69000
Salaries-Bus Dev-EMEA 2012 2 9907.69000 9884.62000 0.00000 9884.62000 19792.31000
Salaries-Bus Dev-EMEA 2012 3 19792.31000 10004.62000 0.00000 10004.62000 29796.93000
Salaries-Bus Dev-EMEA 2012 4 29796.93000 11218.07000 0.00000 11218.07000 41015.00000
Salaries-Bus Dev-EMEA 2012 5 41015.00000 10120.00000 0.00000 10120.00000 51135.00000
Salaries-Bus Dev-EMEA 2012 6 51135.00000 10120.00000 0.00000 10120.00000 61255.00000
Salaries-Bus Dev-EMEA 2012 7 61255.00000 10120.00000 0.00000 10120.00000 71375.00000
Salaries-Bus Dev-EMEA 2012 8 71375.00000 8453.33000 5000.01000 3453.32000 74828.32000
Bonus-Bus Dev-EMEA 2012 1 0.00000 2916.67000 0.00000 2916.67000 2916.67000
Bonus-Bus Dev-EMEA 2012 2 2916.67000 2916.67000 0.00000 2916.67000 5833.34000
Bonus-Bus Dev-EMEA 2012 3 5833.34000 8376.25000 8750.01000 -373.76000 5459.58000
Bonus-Bus Dev-EMEA 2012 4 5459.58000 1784.71000 0.00000 1784.71000 7244.29000
Bonus-Bus Dev-EMEA 2012 5 7244.29000 2379.61000 0.00000 2379.61000 9623.90000
Bonus-Bus Dev-EMEA 2012 6 9623.90000 3079.96000 0.00000 3079.96000 12703.86000
Bonus-Bus Dev-EMEA 2012 7 12703.86000 0.00000 10011.42000 -10011.42000 2692.44000
Bonus-Bus Dev-EMEA 2012 8 2692.44000 0.00000 2692.44000 -2692.44000 0.00000
ER Payroll Taxes-Bus Dev-EMEA 2012 1 0.00000 1607.18000 0.00000 1607.18000 1607.18000
ER Payroll Taxes-Bus Dev-EMEA 2012 2 1607.18000 1604.00000 0.00000 1604.00000 3211.18000
ER Payroll Taxes-Bus Dev-EMEA 2012 3 3211.18000 6237.98000 5071.50000 1166.48000 4377.66000
ER Payroll Taxes-Bus Dev-EMEA 2012 4 4377.66000 1550.52000 0.00000 1550.52000 5928.18000
ER Payroll Taxes-Bus Dev-EMEA 2012 5 5928.18000 1562.37000 0.00000 1562.37000 7490.55000
ER Payroll Taxes-Bus Dev-EMEA 2012 6 7490.55000 1659.02000 0.00000 1659.02000 9149.57000
ER Payroll Taxes-Bus Dev-EMEA 2012 7 9149.57000 1224.33000 1381.58000 -157.25000 8992.32000
ER Payroll Taxes-Bus Dev-EMEA 2012 8 8992.32000 1080.44000 812.87000 267.57000 9259.89000
Travel-Bus Dev-EMEA 2012 1 0.00000 101.00000 5.00000 96.00000 96.00000
Travel-Bus Dev-EMEA 2012 2 96.00000 53.00000 0.00000 53.00000 149.00000
Travel-Bus Dev-EMEA 2012 4 149.00000 186.60000 158.80000 27.80000 176.80000
Travel-Bus Dev-EMEA 2012 6 176.80000 36.00000 24.00000 12.00000 188.80000
Travel-Bus Dev-EMEA 2012 8 188.80000 29.00000 0.00000 29.00000 217.80000
Travel-Car Rental-Bus Dev-EMEA 2012 1 0.00000 9.00000 0.00000 9.00000 9.00000
Travel-Car Rental-Bus Dev-EMEA 2012 2 9.00000 25.50000 0.00000 25.50000 34.50000
Travel-Subsistence-Bus Dev-EMEA 2012 1 0.00000 441.00000 0.00000 441.00000 441.00000
Travel-Subsistence-Bus Dev-EMEA 2012 2 441.00000 131.63000 0.00000 131.63000 572.63000
Travel-Subsistence-Bus Dev-EMEA 2012 3 572.63000 45.59000 0.00000 45.59000 618.22000
Telephone-Bus Dev-EMEA 2012 1 0.00000 98.81000 0.00000 98.81000 98.81000
Telephone-Bus Dev-EMEA 2012 2 98.81000 47.93000 0.00000 47.93000 146.74000
Marketing-Bus Dev-EMEA 2012 1 0.00000 99.01000 0.00000 99.01000 99.01000
Marketing-Bus Dev-EMEA 2012 2 99.01000 5.90000 0.00000 5.90000 104.91000
Marketing-Bus Dev-EMEA 2012 12 104.91000 41.96000 0.00000 41.96000 146.87000
Gen Ops-Overtime-Brighton office closure- 2012 9 0.00000 311.98000 0.00000 311.98000 311.98000
Employee Relations-Acct Mgt-EMEA 2012 9 0.00000 49.00000 0.00000 49.00000 49.00000
Employee Relations-Acct Mgt-EMEA 2012 12 49.00000 11.00000 0.00000 11.00000 60.00000
Prof Fees & Services-Bus Dev-EMEA 2012 10 0.00000 0.00000 10000.00000 -10000.00000 -10000.00000
Bad Debt Expense-Finance-EMEA 2012 10 0.00000 12573.64000 0.00000 12573.64000 12573.64000
Bad Debt Expense-Finance-EMEA 2012 12 12573.64000 0.00000 7500.00000 -7500.00000 5073.64000
Bad Debt Expense-Prov/Write-Off-Finance-EMEA 2012 10 0.00000 9348.00000 1279.00000 8069.00000 8069.00000
Salaries-Finance-EMEA 2012 1 0.00000 7903.20000 0.00000 7903.20000 7903.20000
Salaries-Finance-EMEA 2012 2 7903.20000 8041.66000 0.00000 8041.66000 15944.86000
Salaries-Finance-EMEA 2012 3 15944.86000 7972.43000 0.00000 7972.43000 23917.29000
Salaries-Finance-EMEA 2012 4 23917.29000 8166.34000 0.00000 8166.34000 32083.63000
Salaries-Finance-EMEA 2012 5 32083.63000 8099.38000 0.00000 8099.38000 40183.01000
Salaries-Finance-EMEA 2012 6 40183.01000 6672.50000 0.00000 6672.50000 46855.51000
Salaries-Finance-EMEA 2012 7 46855.51000 6252.50000 0.00000 6252.50000 53108.01000
Salaries-Finance-EMEA 2012 8 53108.01000 6252.50000 0.00000 6252.50000 59360.51000
Salaries-Finance-EMEA 2012 9 59360.51000 6252.50000 0.00000 6252.50000 65613.01000
Salaries-Finance-EMEA 2012 10 65613.01000 6252.50000 0.00000 6252.50000 71865.51000
Salaries-Finance-EMEA 2012 11 71865.51000 6252.50000 0.00000 6252.50000 78118.01000
Salaries-Finance-EMEA 2012 12 78118.01000 4831.69000 0.00000 4831.69000 82949.70000
Overtime-Finance-EMEA -Integration 2012 1 0.00000 3485.87000 0.00000 3485.87000 3485.87000
Overtime-Finance-EMEA -Integration 2012 2 3485.87000 2549.42000 0.00000 2549.42000 6035.29000
Overtime-Finance-EMEA -Integration 2012 3 6035.29000 1520.44000 0.00000 1520.44000 7555.73000
Overtime-Finance-EMEA -Integration 2012 4 7555.73000 2354.07000 2011.00000 343.07000 7898.80000
Overtime-Finance-EMEA -Integration 2012 5 7898.80000 2632.39000 527.00000 2105.39000 10004.19000
Bonus-Finance-EMEA 2012 3 0.00000 561.51000 0.00000 561.51000 561.51000
Bonus-Finance-EMEA 2012 4 561.51000 183.66000 0.00000 183.66000 745.17000
Bonus-Finance-EMEA 2012 5 745.17000 245.17000 0.00000 245.17000 990.34000
Bonus-Finance-EMEA 2012 6 990.34000 317.22000 0.00000 317.22000 1307.56000
Bonus-Finance-EMEA 2012 7 1307.56000 0.00000 529.88000 -529.88000 777.68000
Bonus-Finance-EMEA 2012 8 777.68000 190.69000 0.00000 190.69000 968.37000
Bonus-Finance-EMEA 2012 9 968.37000 185.41000 0.00000 185.41000 1153.78000
Bonus-Finance-EMEA 2012 10 1153.78000 180.14000 0.00000 180.14000 1333.92000
Bonus-Finance-EMEA 2012 11 1333.92000 205.62000 0.00000 205.62000 1539.54000
Bonus-Finance-EMEA 2012 12 1539.54000 32711.91000 37527.01000 -4815.10000 -3275.56000
Holiday-Finance-EMEA 2012 5 0.00000 0.00000 70.62000 -70.62000 -70.62000
Holiday-Finance-EMEA 2012 12 -70.62000 779.70000 0.00000 779.70000 709.08000
ER Payroll Taxes-Finance-EMEA 2012 1 0.00000 765.48000 0.00000 765.48000 765.48000
ER Payroll Taxes-Finance-EMEA 2012 2 765.48000 1136.41000 351.82000 784.59000 1550.07000
ER Payroll Taxes-Finance-EMEA 2012 3 1550.07000 962.24000 109.71000 852.53000 2402.60000
ER Payroll Taxes-Finance-EMEA 2012 4 2402.60000 1079.28000 252.14000 827.14000 3229.74000
ER Payroll Taxes-Finance-EMEA 2012 5 3229.74000 816.64000 0.00000 816.64000 4046.38000
ER Payroll Taxes-Finance-EMEA 2012 6 4046.38000 720.72000 0.00000 720.72000 4767.10000
ER Payroll Taxes-Finance-EMEA 2012 7 4767.10000 690.61000 73.12000 617.49000 5384.59000
ER Payroll Taxes-Finance-EMEA 2012 8 5384.59000 716.92000 0.00000 716.92000 6101.51000
ER Payroll Taxes-Finance-EMEA 2012 9 6101.51000 716.19000 0.00000 716.19000 6817.70000
ER Payroll Taxes-Finance-EMEA 2012 10 6817.70000 715.47000 0.00000 715.47000 7533.17000
ER Payroll Taxes-Finance-EMEA 2012 11 7533.17000 718.99000 0.00000 718.99000 8252.16000
ER Payroll Taxes-Finance-EMEA 2012 12 8252.16000 622.39000 0.00000 622.39000 8874.55000
ER Payroll Taxes-Finance-EMEA -Integration 2012 1 0.00000 481.05000 0.00000 481.05000 481.05000
ER Payroll Taxes-Finance-EMEA -Integration 2012 2 481.05000 351.82000 0.00000 351.82000 832.87000
ER Payroll Taxes-Finance-EMEA -Integration 2012 3 832.87000 209.82000 0.00000 209.82000 1042.69000
ER Payroll Taxes-Finance-EMEA -Integration 2012 4 1042.69000 325.14000 277.17000 47.97000 1090.66000
ER Payroll Taxes-Finance-EMEA -Integration 2012 5 1090.66000 362.92000 73.00000 289.92000 1380.58000
Employee Relations-Finance-EMEA 2012 8 0.00000 48.15000 0.00000 48.15000 48.15000
Employee Relations-Finance-EMEA 2012 9 48.15000 49.35000 0.00000 49.35000 97.50000
Employee Relations-Finance-EMEA 2012 10 97.50000 82.58000 0.00000 82.58000 180.08000
Employee Relations-Finance-EMEA 2012 12 180.08000 110.81000 0.00000 110.81000 290.89000
Travel-Finance-EMEA 2012 5 0.00000 170.50000 0.00000 170.50000 170.50000
Travel-Finance-EMEA 2012 6 170.50000 59.50000 0.00000 59.50000 230.00000
Travel-Finance-EMEA 2012 7 230.00000 69.50000 0.00000 69.50000 299.50000
Travel-Finance-EMEA 2012 8 299.50000 182.00000 0.00000 182.00000 481.50000
Travel-Finance-EMEA 2012 10 481.50000 199.00000 0.00000 199.00000 680.50000
Travel-Finance-EMEA 2012 11 680.50000 10.00000 0.00000 10.00000 690.50000
Travel-Finance-EMEA 2012 12 690.50000 42.00000 0.00000 42.00000 732.50000
Travel-Lodging-Finance-EMEA 2012 10 0.00000 352.38000 0.00000 352.38000 352.38000
Travel-Airfare-Finance-EMEA 2012 8 0.00000 145.98000 0.00000 145.98000 145.98000
Travel-Subsistence-Finance-EMEA 2012 8 0.00000 53.00000 0.00000 53.00000 53.00000
Membership Dues & Fees-Finance-EMEA 2012 12 0.00000 197.00000 0.00000 197.00000 197.00000
Prof Fees & Services-Finance-EMEA 2012 1 0.00000 14.00000 0.00000 14.00000 14.00000
Prof Fees & Services-Finance-EMEA 2012 4 14.00000 7200.00000 0.00000 7200.00000 7214.00000
Prof Fees & Services-Finance-EMEA 2012 5 7214.00000 1800.00000 0.00000 1800.00000 9014.00000
Prof Fees & Services-Finance-EMEA 2012 6 9014.00000 2300.00000 500.00000 1800.00000 10814.00000
Prof Fees & Services-Finance-EMEA 2012 7 10814.00000 1890.00000 0.00000 1890.00000 12704.00000
Prof Fees & Services-Finance-EMEA 2012 8 12704.00000 0.00000 12600.00000 -12600.00000 104.00000
Prof Fees & Services-Finance-EMEA 2012 12 104.00000 40.00000 0.00000 40.00000 144.00000
Audit/Tax Fees-Finance-EMEA 2012 8 0.00000 14400.00000 0.00000 14400.00000 14400.00000
Audit/Tax Fees-Finance-EMEA 2012 9 14400.00000 1800.00000 0.00000 1800.00000 16200.00000
Audit/Tax Fees-Finance-EMEA 2012 10 16200.00000 1800.00000 0.00000 1800.00000 18000.00000
Audit/Tax Fees-Finance-EMEA 2012 11 18000.00000 5800.00000 0.00000 5800.00000 23800.00000
Audit/Tax Fees-Finance-EMEA 2012 12 23800.00000 4800.00000 0.00000 4800.00000 28600.00000
Bank Charges-Finance-EMEA 2012 1 0.00000 148.01000 0.00000 148.01000 148.01000
Bank Charges-Finance-EMEA 2012 2 148.01000 271.57000 0.00000 271.57000 419.58000
Bank Charges-Finance-EMEA 2012 3 419.58000 210.11000 0.00000 210.11000 629.69000
Bank Charges-Finance-EMEA 2012 4 629.69000 188.64000 0.00000 188.64000 818.33000
Bank Charges-Finance-EMEA 2012 5 818.33000 265.86000 0.00000 265.86000 1084.19000
Bank Charges-Finance-EMEA 2012 6 1084.19000 317.31000 0.00000 317.31000 1401.50000
Bank Charges-Finance-EMEA 2012 7 1401.50000 300.59000 0.00000 300.59000 1702.09000
Bank Charges-Finance-EMEA 2012 8 1702.09000 257.53000 0.00000 257.53000 1959.62000
Bank Charges-Finance-EMEA 2012 9 1959.62000 274.26000 0.00000 274.26000 2233.88000
Bank Charges-Finance-EMEA 2012 10 2233.88000 357.90000 8.19000 349.71000 2583.59000
Bank Charges-Finance-EMEA 2012 11 2583.59000 518.64000 182.98000 335.66000 2919.25000
Bank Charges-Finance-EMEA 2012 12 2919.25000 458.68000 5.47000 453.21000 3372.46000
Clearing - General-Finance-EMEA 2012 7 0.00000 2568.00000 2568.00000 0.00000 0.00000
Clearing - General-Finance-EMEA 2012 8 0.00000 1524.00000 1524.00000 0.00000 0.00000
Clearing - General-Finance-EMEA 2012 9 0.00000 924.00000 924.00000 0.00000 0.00000
Clearing - General-Finance-EMEA 2012 10 0.00000 845.79000 845.79000 0.00000 0.00000
Clearing - General-Finance-EMEA 2012 12 0.00000 234.00000 234.00000 0.00000 0.00000
Personal Property Tax-Finance-EMEA 2012 1 0.00000 5033.00000 5033.00000 0.00000 0.00000
Personal Property Tax-Finance-EMEA 2012 2 0.00000 5983.00000 5983.00000 0.00000 0.00000
Personal Property Tax-Finance-EMEA 2012 6 0.00000 5983.00000 5983.00000 0.00000 0.00000
Salaries-Facilities-EMEA 2012 6 0.00000 3500.00000 0.00000 3500.00000 3500.00000
Salaries-Facilities-EMEA 2012 7 3500.00000 0.00000 3500.00000 -3500.00000 0.00000
Salaries-Facilities-EMEA -Integration 2012 7 0.00000 7000.00000 0.00000 7000.00000 7000.00000
Salaries-Facilities-EMEA -Integration 2012 8 7000.00000 3500.00000 0.00000 3500.00000 10500.00000
Salaries-Facilities-EMEA -Integration 2012 9 10500.00000 3500.00000 0.00000 3500.00000 14000.00000
Salaries-Facilities-EMEA -Integration 2012 10 14000.00000 3500.00000 0.00000 3500.00000 17500.00000
Salaries-Facilities-EMEA -Integration 2012 11 17500.00000 1130.77000 0.00000 1130.77000 18630.77000
Holiday-Facilities-EMEA -Integration 2012 11 0.00000 807.70000 0.00000 807.70000 807.70000
ER Payroll Taxes-Facilities-EMEA 2012 6 0.00000 401.71000 0.00000 401.71000 401.71000
ER Payroll Taxes-Facilities-EMEA 2012 7 401.71000 0.00000 401.71000 -401.71000 0.00000
ER Payroll Taxes-Facilities-EMEA -Integration 2012 7 0.00000 798.59000 0.00000 798.59000 798.59000
ER Payroll Taxes-Facilities-EMEA -Integration 2012 8 798.59000 396.88000 0.00000 396.88000 1195.47000
ER Payroll Taxes-Facilities-EMEA -Integration 2012 9 1195.47000 396.88000 0.00000 396.88000 1592.35000
ER Payroll Taxes-Facilities-EMEA -Integration 2012 10 1592.35000 396.88000 0.00000 396.88000 1989.23000
ER Payroll Taxes-Facilities-EMEA -Integration 2012 11 1989.23000 181.40000 0.00000 181.40000 2170.63000
Staff Training-Facilities-EMEA 2012 11 0.00000 754.80000 0.00000 754.80000 754.80000
Travel-Facilities-EMEA 2012 7 0.00000 114.20000 0.00000 114.20000 114.20000
Travel-Facilities-EMEA 2012 8 114.20000 284.80000 0.00000 284.80000 399.00000
Travel-Facilities-EMEA 2012 9 399.00000 41.90000 0.00000 41.90000 440.90000
Travel-Facilities-EMEA -Integration 2012 7 0.00000 499.50000 0.00000 499.50000 499.50000
Travel-Facilities-EMEA -Integration 2012 8 499.50000 162.40000 0.00000 162.40000 661.90000
Travel-Facilities-EMEA -Integration 2012 9 661.90000 246.40000 0.00000 246.40000 908.30000
Travel-Facilities-EMEA -Integration 2012 10 908.30000 258.40000 0.00000 258.40000 1166.70000
Travel-Lodging-Facilities-EMEA -Integration 2012 9 0.00000 368.58000 0.00000 368.58000 368.58000
Travel-Subsistence-Facilities-EMEA 2012 8 0.00000 12.60000 0.00000 12.60000 12.60000
Travel-Subsistence-Facilities-EMEA 2012 9 12.60000 33.36000 0.00000 33.36000 45.96000
Travel-Subsistence-Facilities-EMEA -Integration 2012 7 0.00000 11.28000 0.00000 11.28000 11.28000
Travel-Subsistence-Facilities-EMEA -Integration 2012 9 11.28000 187.54000 0.00000 187.54000 198.82000
Travel-Subsistence-Facilities-EMEA -Integration 2012 10 198.82000 63.75000 0.00000 63.75000 262.57000
Postage-Facilities-EMEA 2012 4 0.00000 408.49000 0.00000 408.49000 408.49000
Utilities-Facilities-EMEA 2012 1 0.00000 682.85000 0.00000 682.85000 682.85000
Utilities-Facilities-EMEA 2012 2 682.85000 833.74000 0.00000 833.74000 1516.59000
Utilities-Facilities-EMEA 2012 3 1516.59000 805.78000 0.00000 805.78000 2322.37000
Utilities-Facilities-EMEA 2012 4 2322.37000 763.04000 0.00000 763.04000 3085.41000
Utilities-Facilities-EMEA 2012 5 3085.41000 1132.58000 0.00000 1132.58000 4217.99000
Utilities-Facilities-EMEA 2012 6 4217.99000 1252.65000 0.00000 1252.65000 5470.64000
Utilities-Facilities-EMEA 2012 7 5470.64000 879.93000 0.00000 879.93000 6350.57000
Utilities-Facilities-EMEA 2012 8 6350.57000 1056.54000 0.00000 1056.54000 7407.11000
Utilities-Facilities-EMEA 2012 9 7407.11000 1252.50000 0.00000 1252.50000 8659.61000
Utilities-Facilities-EMEA 2012 10 8659.61000 1032.45000 0.00000 1032.45000 9692.06000
Utilities-Facilities-EMEA 2012 11 9692.06000 1070.93000 0.00000 1070.93000 10762.99000
Utilities-Facilities-EMEA 2012 12 10762.99000 1349.90000 0.01000 1349.89000 12112.88000
Office Rent-Facilities-EMEA 2012 1 0.00000 21855.67000 12609.70000 9245.97000 9245.97000
Office Rent-Facilities-EMEA 2012 2 9245.97000 21855.67000 12661.70000 9193.97000 18439.94000
Office Rent-Facilities-EMEA 2012 3 18439.94000 22993.58000 13772.26000 9221.32000 27661.26000
Office Rent-Facilities-EMEA 2012 4 27661.26000 24271.67000 13910.10000 10361.57000 38022.83000
Office Rent-Facilities-EMEA 2012 5 38022.83000 25365.67000 16174.61000 9191.06000 47213.89000
Office Rent-Facilities-EMEA 2012 6 47213.89000 24023.82000 13910.09000 10113.73000 57327.62000
Office Rent-Facilities-EMEA 2012 7 57327.62000 23696.67000 13910.10000 9786.57000 67114.19000
Office Rent-Facilities-EMEA 2012 8 67114.19000 47364.48000 102479.51000 -55115.03000 11999.16000
Office Rent-Facilities-EMEA 2012 9 11999.16000 15455.67000 13910.10000 1545.57000 13544.73000
Office Rent-Facilities-EMEA 2012 10 13544.73000 15455.67000 13910.10000 1545.57000 15090.30000
Office Rent-Facilities-EMEA 2012 11 15090.30000 15455.67000 13910.10000 1545.57000 16635.87000
Office Rent-Facilities-EMEA 2012 12 16635.87000 14502.07000 12956.51000 1545.56000 18181.43000
CAM Charges-Facilities-EMEA 2012 8 0.00000 81940.79000 0.00000 81940.79000 81940.79000
CAM Charges-Facilities-EMEA 2012 9 81940.79000 9156.00000 0.00000 9156.00000 91096.79000
CAM Charges-Facilities-EMEA 2012 10 91096.79000 9156.00000 0.00000 9156.00000 100252.79000
CAM Charges-Facilities-EMEA 2012 11 100252.79000 9156.00000 0.00000 9156.00000 109408.79000
CAM Charges-Facilities-EMEA 2012 12 109408.79000 7472.52000 0.00000 7472.52000 116881.31000
Repair & Maintenance-Facilities-EMEA 2012 1 0.00000 743.19000 0.00000 743.19000 743.19000
Repair & Maintenance-Facilities-EMEA 2012 2 743.19000 927.39000 0.00000 927.39000 1670.58000
Repair & Maintenance-Facilities-EMEA 2012 3 1670.58000 597.99000 0.00000 597.99000 2268.57000
Repair & Maintenance-Facilities-EMEA 2012 4 2268.57000 974.33000 0.00000 974.33000 3242.90000
Repair & Maintenance-Facilities-EMEA 2012 5 3242.90000 1165.59000 0.00000 1165.59000 4408.49000
Repair & Maintenance-Facilities-EMEA 2012 6 4408.49000 836.19000 0.00000 836.19000 5244.68000
Repair & Maintenance-Facilities-EMEA 2012 7 5244.68000 1165.59000 0.00000 1165.59000 6410.27000
Repair & Maintenance-Facilities-EMEA 2012 8 6410.27000 836.19000 0.00000 836.19000 7246.46000
Repair & Maintenance-Facilities-EMEA 2012 9 7246.46000 864.39000 0.00000 864.39000 8110.85000
Repair & Maintenance-Facilities-EMEA 2012 10 8110.85000 924.19000 0.00000 924.19000 9035.04000
Repair & Maintenance-Facilities-EMEA 2012 11 9035.04000 2740.59000 0.00000 2740.59000 11775.63000
Repair & Maintenance-Facilities-EMEA 2012 12 11775.63000 3125.87000 154.00000 2971.87000 14747.50000
Insurance-Facilities-EMEA 2012 1 0.00000 913.76000 508.25000 405.51000 405.51000
Insurance-Facilities-EMEA 2012 2 405.51000 902.00000 0.00000 902.00000 1307.51000
Insurance-Facilities-EMEA 2012 3 1307.51000 902.00000 0.00000 902.00000 2209.51000
Insurance-Facilities-EMEA 2012 4 2209.51000 972.00000 0.00000 972.00000 3181.51000
Insurance-Facilities-EMEA 2012 5 3181.51000 972.00000 881.83000 90.17000 3271.68000
Insurance-Facilities-EMEA 2012 6 3271.68000 972.00000 0.00000 972.00000 4243.68000
Insurance-Facilities-EMEA 2012 7 4243.68000 972.00000 0.00000 972.00000 5215.68000
Insurance-Facilities-EMEA 2012 8 5215.68000 972.00000 0.00000 972.00000 6187.68000
Insurance-Facilities-EMEA 2012 9 6187.68000 592.00000 0.00000 592.00000 6779.68000
Insurance-Facilities-EMEA 2012 10 6779.68000 592.00000 1500.00000 -908.00000 5871.68000
Insurance-Facilities-EMEA 2012 11 5871.68000 592.00000 0.00000 592.00000 6463.68000
Insurance-Facilities-EMEA 2012 12 6463.68000 592.00000 774.44000 -182.44000 6281.24000
Office Supplies-Facilities-EMEA 2012 11 0.00000 2083.10000 0.00000 2083.10000 2083.10000
Office Supplies-Facilities-EMEA 2012 12 2083.10000 85.20000 0.00000 85.20000 2168.30000
Consulting-Facilities-EMEA 2012 9 0.00000 719.20000 0.00000 719.20000 719.20000
Consulting-Facilities-EMEA 2012 10 719.20000 359.58000 0.00000 359.58000 1078.78000
Consulting-Facilities-EMEA 2012 11 1078.78000 359.58000 0.00000 359.58000 1438.36000
Consulting-Facilities-EMEA 2012 12 1438.36000 359.58000 0.00000 359.58000 1797.94000
Recruitment-Facilities-EMEA -Integration 2012 7 0.00000 8400.00000 0.00000 8400.00000 8400.00000
Personal Property Tax-Facilities-EMEA 2012 1 0.00000 5983.00000 0.00000 5983.00000 5983.00000
Personal Property Tax-Facilities-EMEA 2012 2 5983.00000 5983.00000 0.00000 5983.00000 11966.00000
Personal Property Tax-Facilities-EMEA 2012 3 11966.00000 5983.00000 0.00000 5983.00000 17949.00000
Personal Property Tax-Facilities-EMEA 2012 4 17949.00000 6733.00000 0.00000 6733.00000 24682.00000
Personal Property Tax-Facilities-EMEA 2012 5 24682.00000 6733.00000 0.00000 6733.00000 31415.00000
Personal Property Tax-Facilities-EMEA 2012 6 31415.00000 8048.43000 950.00000 7098.43000 38513.43000
Personal Property Tax-Facilities-EMEA 2012 7 38513.43000 7016.00000 0.00000 7016.00000 45529.43000
Personal Property Tax-Facilities-EMEA 2012 8 45529.43000 20302.28000 15550.00000 4752.28000 50281.71000
Personal Property Tax-Facilities-EMEA 2012 9 50281.71000 6882.00000 0.00000 6882.00000 57163.71000
Personal Property Tax-Facilities-EMEA 2012 10 57163.71000 6882.00000 0.00000 6882.00000 64045.71000
Personal Property Tax-Facilities-EMEA 2012 11 64045.71000 12939.25000 6000.00000 6939.25000 70984.96000
Personal Property Tax-Facilities-EMEA 2012 12 70984.96000 6863.00000 0.00000 6863.00000 77847.96000
Other Income / Expense-Facilities-EMEA 2012 1 0.00000 15.83000 0.00000 15.83000 15.83000
Other Income / Expense-Facilities-EMEA 2012 2 15.83000 133.25000 0.00000 133.25000 149.08000
Other Income / Expense-Facilities-EMEA 2012 3 149.08000 167.44000 0.00000 167.44000 316.52000
Other Income / Expense-Facilities-EMEA 2012 4 316.52000 1073.91000 0.00000 1073.91000 1390.43000
Other Income / Expense-Facilities-EMEA 2012 5 1390.43000 39.86000 0.00000 39.86000 1430.29000
Other Income / Expense-Facilities-EMEA 2012 6 1430.29000 174.28000 0.00000 174.28000 1604.57000
Other Income / Expense-Facilities-EMEA 2012 7 1604.57000 324.73000 0.00000 324.73000 1929.30000
Other Income / Expense-Facilities-EMEA 2012 9 1929.30000 323.40000 0.00000 323.40000 2252.70000
Other Income / Expense-Facilities-EMEA 2012 10 2252.70000 319.48000 0.00000 319.48000 2572.18000
Other Income / Expense-Facilities-EMEA 2012 11 2572.18000 66.21000 0.00000 66.21000 2638.39000
Other Income / Expense-Facilities-EMEA 2012 12 2638.39000 780.35000 0.00000 780.35000 3418.74000
Salaries-IT Infra-EMEA 2012 4 0.00000 2804.49000 0.00000 2804.49000 2804.49000
Salaries-IT Infra-EMEA 2012 5 2804.49000 2083.33000 0.00000 2083.33000 4887.82000
Salaries-IT Infra-EMEA 2012 6 4887.82000 2083.33000 0.00000 2083.33000 6971.15000
Salaries-IT Infra-EMEA 2012 7 6971.15000 2083.33000 0.00000 2083.33000 9054.48000
Salaries-IT Infra-EMEA 2012 8 9054.48000 2083.33000 0.00000 2083.33000 11137.81000
Salaries-IT Infra-EMEA 2012 9 11137.81000 2083.33000 0.00000 2083.33000 13221.14000
Salaries-IT Infra-EMEA 2012 10 13221.14000 2083.33000 0.00000 2083.33000 15304.47000
Salaries-IT Infra-EMEA 2012 11 15304.47000 2083.33000 0.00000 2083.33000 17387.80000
Salaries-IT Infra-EMEA 2012 12 17387.80000 2083.33000 0.00000 2083.33000 19471.13000
Salaries-IT Infra-EMEA -Integration 2012 1 0.00000 3437.50000 0.00000 3437.50000 3437.50000
Salaries-IT Infra-EMEA -Integration 2012 2 3437.50000 3278.85000 0.00000 3278.85000 6716.35000
Salaries-IT Infra-EMEA -Integration 2012 3 6716.35000 3437.50000 0.00000 3437.50000 10153.85000
Salaries-IT Infra-EMEA -Integration 2012 4 10153.85000 634.62000 0.00000 634.62000 10788.47000
Bonus-IT Infra-EMEA -Integration 2012 3 0.00000 321.62000 0.00000 321.62000 321.62000
Bonus-IT Infra-EMEA -Integration 2012 4 321.62000 105.45000 0.00000 105.45000 427.07000
Bonus-IT Infra-EMEA -Integration 2012 5 427.07000 140.60000 0.00000 140.60000 567.67000
Bonus-IT Infra-EMEA -Integration 2012 6 567.67000 181.90000 0.00000 181.90000 749.57000
Bonus-IT Infra-EMEA -Integration 2012 7 749.57000 0.00000 589.63000 -589.63000 159.94000
Bonus-IT Infra-EMEA -Integration 2012 8 159.94000 38.66000 0.00000 38.66000 198.60000
Bonus-IT Infra-EMEA -Integration 2012 9 198.60000 37.79000 0.00000 37.79000 236.39000
Bonus-IT Infra-EMEA -Integration 2012 10 236.39000 36.91000 0.00000 36.91000 273.30000
Bonus-IT Infra-EMEA -Integration 2012 11 273.30000 42.18000 0.00000 42.18000 315.48000
Bonus-IT Infra-EMEA -Integration 2012 12 315.48000 29.88000 0.00000 29.88000 345.36000
ER Payroll Taxes-IT Infra-EMEA 2012 4 0.00000 224.45000 0.00000 224.45000 224.45000
ER Payroll Taxes-IT Infra-EMEA 2012 5 224.45000 206.21000 0.00000 206.21000 430.66000
ER Payroll Taxes-IT Infra-EMEA 2012 6 430.66000 206.21000 0.00000 206.21000 636.87000
ER Payroll Taxes-IT Infra-EMEA 2012 7 636.87000 201.39000 0.00000 201.39000 838.26000
ER Payroll Taxes-IT Infra-EMEA 2012 8 838.26000 201.39000 0.00000 201.39000 1039.65000
ER Payroll Taxes-IT Infra-EMEA 2012 9 1039.65000 201.39000 0.00000 201.39000 1241.04000
ER Payroll Taxes-IT Infra-EMEA 2012 10 1241.04000 201.39000 0.00000 201.39000 1442.43000
ER Payroll Taxes-IT Infra-EMEA 2012 11 1442.43000 201.39000 0.00000 201.39000 1643.82000
ER Payroll Taxes-IT Infra-EMEA 2012 12 1643.82000 201.39000 0.00000 201.39000 1845.21000
ER Payroll Taxes-IT Infra-EMEA -Integration 2012 1 0.00000 393.09000 0.00000 393.09000 393.09000
ER Payroll Taxes-IT Infra-EMEA -Integration 2012 2 393.09000 371.19000 0.00000 371.19000 764.28000
ER Payroll Taxes-IT Infra-EMEA -Integration 2012 3 764.28000 437.47000 0.00000 437.47000 1201.75000
ER Payroll Taxes-IT Infra-EMEA -Integration 2012 4 1201.75000 20.84000 0.00000 20.84000 1222.59000
ER Payroll Taxes-IT Infra-EMEA -Integration 2012 5 1222.59000 19.40000 0.00000 19.40000 1241.99000
ER Payroll Taxes-IT Infra-EMEA -Integration 2012 6 1241.99000 25.10000 0.00000 25.10000 1267.09000
ER Payroll Taxes-IT Infra-EMEA -Integration 2012 7 1267.09000 0.00000 81.37000 -81.37000 1185.72000
ER Payroll Taxes-IT Infra-EMEA -Integration 2012 8 1185.72000 5.34000 0.00000 5.34000 1191.06000
ER Payroll Taxes-IT Infra-EMEA -Integration 2012 9 1191.06000 5.21000 0.00000 5.21000 1196.27000
ER Payroll Taxes-IT Infra-EMEA -Integration 2012 10 1196.27000 5.09000 0.00000 5.09000 1201.36000
ER Payroll Taxes-IT Infra-EMEA -Integration 2012 11 1201.36000 5.82000 0.00000 5.82000 1207.18000
ER Payroll Taxes-IT Infra-EMEA -Integration 2012 12 1207.18000 4.12000 0.00000 4.12000 1211.30000
Travel-IT Infra-EMEA 2012 5 0.00000 32.20000 0.00000 32.20000 32.20000
Travel-IT Infra-EMEA 2012 7 32.20000 84.60000 0.00000 84.60000 116.80000
Travel-IT Infra-EMEA 2012 8 116.80000 26.60000 0.00000 26.60000 143.40000
Travel-IT Infra-EMEA 2012 11 143.40000 24.20000 0.00000 24.20000 167.60000
Travel-IT Infra-EMEA 2012 12 167.60000 24.20000 0.00000 24.20000 191.80000
Travel-Lodging-IT Infra-EMEA 2012 5 0.00000 179.38000 0.00000 179.38000 179.38000
Travel-Airfare-IT Infra-EMEA 2012 9 0.00000 153.79000 0.00000 153.79000 153.79000
Travel-Subsistence-IT Infra-EMEA 2012 10 0.00000 4.99000 0.00000 4.99000 4.99000
Freight-IT Infra-EMEA 2012 9 0.00000 302.16000 0.00000 302.16000 302.16000
Freight-IT Infra-EMEA 2012 10 302.16000 58.19000 0.00000 58.19000 360.35000
Freight-IT Infra-EMEA 2012 12 360.35000 933.21000 360.35000 572.86000 933.21000
Telephone-IT Infra-EMEA 2012 1 0.00000 2978.38000 0.00000 2978.38000 2978.38000
Telephone-IT Infra-EMEA 2012 2 2978.38000 2908.70000 0.00000 2908.70000 5887.08000
Telephone-IT Infra-EMEA 2012 3 5887.08000 2707.44000 0.00000 2707.44000 8594.52000
Telephone-IT Infra-EMEA 2012 4 8594.52000 2631.53000 0.00000 2631.53000 11226.05000
Telephone-IT Infra-EMEA 2012 5 11226.05000 3299.57000 607.50000 2692.07000 13918.12000
Telephone-IT Infra-EMEA 2012 6 13918.12000 3969.18000 0.00000 3969.18000 17887.30000
Telephone-IT Infra-EMEA 2012 7 17887.30000 4592.86000 0.00000 4592.86000 22480.16000
Telephone-IT Infra-EMEA 2012 8 22480.16000 6424.41000 0.00000 6424.41000 28904.57000
Telephone-IT Infra-EMEA 2012 9 28904.57000 5366.20000 0.00000 5366.20000 34270.77000
Telephone-IT Infra-EMEA 2012 10 34270.77000 3662.10000 0.00000 3662.10000 37932.87000
Telephone-IT Infra-EMEA 2012 11 37932.87000 4240.08000 0.00000 4240.08000 42172.95000
Telephone-IT Infra-EMEA 2012 12 42172.95000 3548.74000 0.00000 3548.74000 45721.69000
Data Circuits-IT Infra-EMEA 2012 1 0.00000 80.15000 0.00000 80.15000 80.15000
Data Circuits-IT Infra-EMEA 2012 2 80.15000 77.04000 0.00000 77.04000 157.19000
Data Circuits-IT Infra-EMEA 2012 3 157.19000 6131.52000 0.00000 6131.52000 6288.71000
Data Circuits-IT Infra-EMEA 2012 4 6288.71000 1789.52000 0.00000 1789.52000 8078.23000
Data Circuits-IT Infra-EMEA 2012 5 8078.23000 4750.35000 0.00000 4750.35000 12828.58000
Data Circuits-IT Infra-EMEA 2012 6 12828.58000 3824.40000 0.00000 3824.40000 16652.98000
Data Circuits-IT Infra-EMEA 2012 7 16652.98000 3787.11000 0.00000 3787.11000 20440.09000
Data Circuits-IT Infra-EMEA 2012 8 20440.09000 1264.41000 0.00000 1264.41000 21704.50000
Data Circuits-IT Infra-EMEA 2012 9 21704.50000 1299.37000 0.00000 1299.37000 23003.87000
Data Circuits-IT Infra-EMEA 2012 10 23003.87000 1295.31000 0.00000 1295.31000 24299.18000
Data Circuits-IT Infra-EMEA 2012 11 24299.18000 1286.37000 0.00000 1286.37000 25585.55000
Data Circuits-IT Infra-EMEA 2012 12 25585.55000 4717.66000 1901.67000 2815.99000 28401.54000
Repair & Maintenance-IT Infra-EMEA 2012 1 0.00000 168.00000 0.00000 168.00000 168.00000
Repair & Maintenance-IT Infra-EMEA 2012 2 168.00000 168.00000 0.00000 168.00000 336.00000
Repair & Maintenance-IT Infra-EMEA 2012 3 336.00000 168.00000 0.00000 168.00000 504.00000
Repair & Maintenance-IT Infra-EMEA 2012 4 504.00000 168.00000 0.00000 168.00000 672.00000
Repair & Maintenance-IT Infra-EMEA 2012 5 672.00000 168.00000 0.00000 168.00000 840.00000
Repair & Maintenance-IT Infra-EMEA 2012 6 840.00000 168.00000 0.00000 168.00000 1008.00000
Repair & Maintenance-IT Infra-EMEA 2012 7 1008.00000 167.00000 0.00000 167.00000 1175.00000
Repair & Maintenance-IT Infra-EMEA 2012 8 1175.00000 168.00000 0.00000 168.00000 1343.00000
Repair & Maintenance-IT Infra-EMEA 2012 9 1343.00000 168.00000 0.00000 168.00000 1511.00000
Repair & Maintenance-IT Infra-EMEA 2012 10 1511.00000 809.30000 0.00000 809.30000 2320.30000
Repair & Maintenance-IT Infra-EMEA 2012 11 2320.30000 2588.00000 0.00000 2588.00000 4908.30000
Repair & Maintenance-IT Infra-EMEA 2012 12 4908.30000 284.00000 389.53000 -105.53000 4802.77000
Maintenance Agreements-IT Infra-EMEA 2012 12 0.00000 1456.48000 0.00000 1456.48000 1456.48000
Office Supplies-IT Infra-EMEA 2012 1 0.00000 1516.67000 0.00000 1516.67000 1516.67000
Office Supplies-IT Infra-EMEA 2012 2 1516.67000 1240.00000 0.00000 1240.00000 2756.67000
Office Supplies-IT Infra-EMEA 2012 3 2756.67000 1720.14000 0.00000 1720.14000 4476.81000
Office Supplies-IT Infra-EMEA 2012 4 4476.81000 1425.69000 0.00000 1425.69000 5902.50000
Office Supplies-IT Infra-EMEA 2012 5 5902.50000 1588.93000 0.00000 1588.93000 7491.43000
Office Supplies-IT Infra-EMEA 2012 6 7491.43000 1377.00000 0.00000 1377.00000 8868.43000
Office Supplies-IT Infra-EMEA 2012 7 8868.43000 1320.00000 0.00000 1320.00000 10188.43000
Office Supplies-IT Infra-EMEA 2012 8 10188.43000 837.83000 0.00000 837.83000 11026.26000
Office Supplies-IT Infra-EMEA 2012 9 11026.26000 463.99000 0.00000 463.99000 11490.25000
Office Supplies-IT Infra-EMEA 2012 10 11490.25000 740.00000 0.00000 740.00000 12230.25000
Office Supplies-IT Infra-EMEA 2012 11 12230.25000 568.59000 0.00000 568.59000 12798.84000
Office Supplies-IT Infra-EMEA 2012 12 12798.84000 1078.00000 0.00000 1078.00000 13876.84000
Office Supplies-IT Infra-EMEA -Integration 2012 1 0.00000 287.43000 0.00000 287.43000 287.43000
Office Supplies-IT Infra-EMEA -Integration 2012 2 287.43000 179.15000 0.00000 179.15000 466.58000
Office Supplies-IT Infra-EMEA -Integration 2012 3 466.58000 179.15000 0.00000 179.15000 645.73000
Office Supplies-IT Infra-EMEA -Integration 2012 4 645.73000 612.79000 0.00000 612.79000 1258.52000
Office Supplies-IT Infra-EMEA -Integration 2012 5 1258.52000 895.83000 0.00000 895.83000 2154.35000
Prof Fees & Services-IT Infra-EMEA 2012 6 0.00000 2300.00000 0.00000 2300.00000 2300.00000
Recog Gain/Loss on Asset Disposal-IT Infra-EMEA 2012 7 0.00000 279.61000 0.00000 279.61000 279.61000
Salaries-IT Develop-EMEA 2012 1 0.00000 2916.67000 0.00000 2916.67000 2916.67000
Salaries-IT Develop-EMEA 2012 2 2916.67000 7711.54000 4794.87000 2916.67000 5833.34000
Salaries-IT Develop-EMEA 2012 3 5833.34000 2916.67000 0.00000 2916.67000 8750.01000
Salaries-IT Develop-EMEA 2012 4 8750.01000 134.62000 0.00000 134.62000 8884.63000
Salaries-IT Develop-EMEA 2012 5 8884.63000 3954.80000 0.00000 3954.80000 12839.43000
Salaries-IT Develop-EMEA 2012 6 12839.43000 624.00000 0.00000 624.00000 13463.43000
Salaries-IT Develop-EMEA 2012 7 13463.43000 677.25000 0.00000 677.25000 14140.68000
Salaries-IT Develop-EMEA 2012 8 14140.68000 541.80000 0.00000 541.80000 14682.48000
Salaries-IT Develop-EMEA 2012 9 14682.48000 2708.47000 0.00000 2708.47000 17390.95000
Salaries-IT Develop-EMEA 2012 10 17390.95000 2843.92000 0.00000 2843.92000 20234.87000
Salaries-IT Develop-EMEA 2012 11 20234.87000 2708.47000 0.00000 2708.47000 22943.34000
Salaries-IT Develop-EMEA 2012 12 22943.34000 2708.47000 0.00000 2708.47000 25651.81000
Bonus-IT Develop-EMEA 2012 11 0.00000 5000.00000 5000.00000 0.00000 0.00000
Holiday-IT Develop-EMEA 2012 4 0.00000 403.86000 0.00000 403.86000 403.86000
ER Payroll Taxes-IT Develop-EMEA 2012 1 0.00000 321.21000 0.00000 321.21000 321.21000
ER Payroll Taxes-IT Develop-EMEA 2012 2 321.21000 901.61000 580.40000 321.21000 642.42000
ER Payroll Taxes-IT Develop-EMEA 2012 3 642.42000 321.21000 0.00000 321.21000 963.63000
ER Payroll Taxes-IT Develop-EMEA 2012 5 963.63000 464.47000 0.00000 464.47000 1428.10000
ER Payroll Taxes-IT Develop-EMEA 2012 6 1428.10000 4.83000 0.00000 4.83000 1432.93000
ER Payroll Taxes-IT Develop-EMEA 2012 7 1432.93000 7.35000 0.00000 7.35000 1440.28000
ER Payroll Taxes-IT Develop-EMEA 2012 9 1440.28000 212.88000 0.00000 212.88000 1653.16000
ER Payroll Taxes-IT Develop-EMEA 2012 10 1653.16000 220.24000 0.00000 220.24000 1873.40000
ER Payroll Taxes-IT Develop-EMEA 2012 11 1873.40000 902.89000 690.00000 212.89000 2086.29000
ER Payroll Taxes-IT Develop-EMEA 2012 12 2086.29000 212.89000 0.00000 212.89000 2299.18000
Staff Training-IT Develop-EMEA 2012 10 0.00000 1045.00000 0.00000 1045.00000 1045.00000
Data Circuits-IT Develop-EMEA 2012 3 0.00000 690.62000 0.00000 690.62000 690.62000
Data Circuits-IT Develop-EMEA 2012 4 690.62000 560.00000 0.00000 560.00000 1250.62000
Data Circuits-IT Develop-EMEA 2012 5 1250.62000 560.00000 0.00000 560.00000 1810.62000
Data Circuits-IT Develop-EMEA 2012 6 1810.62000 560.00000 0.00000 560.00000 2370.62000
Data Circuits-IT Develop-EMEA 2012 7 2370.62000 560.00000 0.00000 560.00000 2930.62000
Data Circuits-IT Develop-EMEA 2012 8 2930.62000 560.00000 0.00000 560.00000 3490.62000
Data Circuits-IT Develop-EMEA 2012 9 3490.62000 560.00000 0.00000 560.00000 4050.62000
Data Circuits-IT Develop-EMEA 2012 10 4050.62000 565.98000 0.00000 565.98000 4616.60000
Data Circuits-IT Develop-EMEA 2012 11 4616.60000 560.00000 0.00000 560.00000 5176.60000
Data Circuits-IT Develop-EMEA 2012 12 5176.60000 560.00000 0.00000 560.00000 5736.60000
Office Supplies-IT Develop-EMEA 2012 3 0.00000 809.00000 0.00000 809.00000 809.00000
Office Supplies-IT Develop-EMEA 2012 4 809.00000 64.99000 0.00000 64.99000 873.99000
Salaries-IT Security-EMEA 2012 2 0.00000 4794.87000 0.00000 4794.87000 4794.87000
Salaries-IT Security-EMEA 2012 3 4794.87000 4583.33000 0.00000 4583.33000 9378.20000
Salaries-IT Security-EMEA 2012 4 9378.20000 4583.33000 0.00000 4583.33000 13961.53000
Salaries-IT Security-EMEA 2012 5 13961.53000 4583.33000 0.00000 4583.33000 18544.86000
Salaries-IT Security-EMEA 2012 6 18544.86000 4583.33000 0.00000 4583.33000 23128.19000
Salaries-IT Security-EMEA 2012 7 23128.19000 4583.33000 0.00000 4583.33000 27711.52000
Salaries-IT Security-EMEA 2012 8 27711.52000 4583.33000 0.00000 4583.33000 32294.85000
Salaries-IT Security-EMEA 2012 9 32294.85000 4583.33000 0.00000 4583.33000 36878.18000
Salaries-IT Security-EMEA 2012 10 36878.18000 4583.33000 0.00000 4583.33000 41461.51000
Salaries-IT Security-EMEA 2012 11 41461.51000 4583.33000 0.00000 4583.33000 46044.84000
Salaries-IT Security-EMEA 2012 12 46044.84000 4583.33000 0.00000 4583.33000 50628.17000
Bonus-IT Security-EMEA 2012 3 0.00000 857.64000 0.00000 857.64000 857.64000
Bonus-IT Security-EMEA 2012 4 857.64000 280.31000 0.00000 280.31000 1137.95000
Bonus-IT Security-EMEA 2012 5 1137.95000 374.34000 0.00000 374.34000 1512.29000
Bonus-IT Security-EMEA 2012 6 1512.29000 484.19000 0.00000 484.19000 1996.48000
Bonus-IT Security-EMEA 2012 7 1996.48000 0.00000 1572.93000 -1572.93000 423.55000
Bonus-IT Security-EMEA 2012 8 423.55000 103.69000 0.00000 103.69000 527.24000
Bonus-IT Security-EMEA 2012 9 527.24000 101.05000 0.00000 101.05000 628.29000
Bonus-IT Security-EMEA 2012 10 628.29000 98.42000 0.00000 98.42000 726.71000
Bonus-IT Security-EMEA 2012 11 726.71000 111.60000 0.00000 111.60000 838.31000
Bonus-IT Security-EMEA 2012 12 838.31000 79.96000 0.00000 79.96000 918.27000
ER Payroll Taxes-IT Security-EMEA 2012 2 0.00000 580.40000 0.00000 580.40000 580.40000
ER Payroll Taxes-IT Security-EMEA 2012 3 580.40000 669.57000 0.00000 669.57000 1249.97000
ER Payroll Taxes-IT Security-EMEA 2012 4 1249.97000 589.90000 0.00000 589.90000 1839.87000
ER Payroll Taxes-IT Security-EMEA 2012 5 1839.87000 602.87000 0.00000 602.87000 2442.74000
ER Payroll Taxes-IT Security-EMEA 2012 6 2442.74000 618.02000 0.00000 618.02000 3060.76000
ER Payroll Taxes-IT Security-EMEA 2012 7 3060.76000 546.38000 217.07000 329.31000 3390.07000
ER Payroll Taxes-IT Security-EMEA 2012 8 3390.07000 560.69000 0.00000 560.69000 3950.76000
ER Payroll Taxes-IT Security-EMEA 2012 9 3950.76000 560.33000 0.00000 560.33000 4511.09000
ER Payroll Taxes-IT Security-EMEA 2012 10 4511.09000 559.96000 0.00000 559.96000 5071.05000
ER Payroll Taxes-IT Security-EMEA 2012 11 5071.05000 561.78000 0.00000 561.78000 5632.83000
ER Payroll Taxes-IT Security-EMEA 2012 12 5632.83000 557.42000 0.00000 557.42000 6190.25000
Travel-IT Security-EMEA 2012 3 0.00000 535.20000 0.00000 535.20000 535.20000
Travel-IT Security-EMEA 2012 4 535.20000 193.60000 0.00000 193.60000 728.80000
Travel-IT Security-EMEA 2012 6 728.80000 375.20000 0.00000 375.20000 1104.00000
Travel-IT Security-EMEA 2012 7 1104.00000 255.60000 0.00000 255.60000 1359.60000
Travel-IT Security-EMEA 2012 8 1359.60000 199.80000 0.00000 199.80000 1559.40000
Travel-IT Security-EMEA 2012 9 1559.40000 99.90000 0.00000 99.90000 1659.30000
Travel-IT Security-EMEA 2012 12 1659.30000 155.70000 0.00000 155.70000 1815.00000
Legal Fees-Legal/Comp-EMEA 2012 7 0.00000 165000.00000 0.00000 165000.00000 165000.00000
Legal Fees-Legal/Comp-EMEA 2012 8 165000.00000 0.00000 165000.00000 -165000.00000 0.00000
Legal Fees-Legal/Comp-EMEA -PC Acquisition 2012 8 0.00000 165000.00000 0.00000 165000.00000 165000.00000
Legal/Compliance-Legal Fees-PC AQUIS- 2012 8 0.00000 8136.75000 0.00000 8136.75000 8136.75000
Salaries-HR-EMEA 2012 1 0.00000 1500.00000 0.00000 1500.00000 1500.00000
Salaries-HR-EMEA 2012 2 1500.00000 1500.00000 0.00000 1500.00000 3000.00000
Salaries-HR-EMEA 2012 3 3000.00000 1500.00000 0.00000 1500.00000 4500.00000
Salaries-HR-EMEA 2012 4 4500.00000 1535.42000 0.00000 1535.42000 6035.42000
Salaries-HR-EMEA 2012 5 6035.42000 1535.42000 0.00000 1535.42000 7570.84000
Salaries-HR-EMEA 2012 6 7570.84000 1535.42000 0.00000 1535.42000 9106.26000
Salaries-HR-EMEA 2012 7 9106.26000 1535.42000 0.00000 1535.42000 10641.68000
Salaries-HR-EMEA 2012 8 10641.68000 1535.42000 0.00000 1535.42000 12177.10000
Salaries-HR-EMEA 2012 9 12177.10000 1535.42000 0.00000 1535.42000 13712.52000
Salaries-HR-EMEA 2012 10 13712.52000 1535.42000 0.00000 1535.42000 15247.94000
Salaries-HR-EMEA 2012 11 15247.94000 1535.42000 0.00000 1535.42000 16783.36000
Salaries-HR-EMEA 2012 12 16783.36000 3262.98000 0.00000 3262.98000 20046.34000
ER Payroll Taxes-HR-EMEA 2012 1 0.00000 125.71000 0.00000 125.71000 125.71000
ER Payroll Taxes-HR-EMEA 2012 2 125.71000 125.71000 0.00000 125.71000 251.42000
ER Payroll Taxes-HR-EMEA 2012 3 251.42000 125.71000 0.00000 125.71000 377.13000
ER Payroll Taxes-HR-EMEA 2012 4 377.13000 130.60000 0.00000 130.60000 507.73000
ER Payroll Taxes-HR-EMEA 2012 5 507.73000 130.60000 0.00000 130.60000 638.33000
ER Payroll Taxes-HR-EMEA 2012 6 638.33000 130.60000 0.00000 130.60000 768.93000
ER Payroll Taxes-HR-EMEA 2012 7 768.93000 125.77000 0.00000 125.77000 894.70000
ER Payroll Taxes-HR-EMEA 2012 8 894.70000 125.77000 0.00000 125.77000 1020.47000
ER Payroll Taxes-HR-EMEA 2012 9 1020.47000 125.77000 0.00000 125.77000 1146.24000
ER Payroll Taxes-HR-EMEA 2012 10 1146.24000 125.77000 0.00000 125.77000 1272.01000
ER Payroll Taxes-HR-EMEA 2012 11 1272.01000 125.77000 0.00000 125.77000 1397.78000
ER Payroll Taxes-HR-EMEA 2012 12 1397.78000 60.58000 0.00000 60.58000 1458.36000
Employee Relations-HR-EMEA 2012 5 0.00000 77.00000 0.00000 77.00000 77.00000
Employee Relations-HR-EMEA 2012 10 77.00000 500.00000 0.00000 500.00000 577.00000
Employee Relations-HR-EMEA 2012 11 577.00000 403.75000 500.00000 -96.25000 480.75000
Staff Training-HR-EMEA 2012 10 0.00000 400.00000 0.00000 400.00000 400.00000
Travel-HR-EMEA 2012 3 0.00000 30.80000 0.00000 30.80000 30.80000
Travel-HR-EMEA 2012 6 30.80000 4.30000 0.00000 4.30000 35.10000
Travel-HR-EMEA 2012 7 35.10000 18.30000 0.00000 18.30000 53.40000
Travel-Subsistence-HR-EMEA 2012 11 0.00000 11.05000 0.00000 11.05000 11.05000
Prof Fees & Services-HR-EMEA 2012 1 0.00000 300.74000 0.00000 300.74000 300.74000
Prof Fees & Services-HR-EMEA 2012 2 300.74000 298.64000 0.00000 298.64000 599.38000
Prof Fees & Services-HR-EMEA 2012 3 599.38000 326.81000 0.00000 326.81000 926.19000
Prof Fees & Services-HR-EMEA 2012 4 926.19000 385.86000 0.00000 385.86000 1312.05000
Prof Fees & Services-HR-EMEA 2012 5 1312.05000 363.44000 0.00000 363.44000 1675.49000
Prof Fees & Services-HR-EMEA 2012 6 1675.49000 859.21000 363.44000 495.77000 2171.26000
Prof Fees & Services-HR-EMEA 2012 7 2171.26000 994.74000 500.00000 494.74000 2666.00000
Prof Fees & Services-HR-EMEA 2012 8 2666.00000 448.32000 0.00000 448.32000 3114.32000
Prof Fees & Services-HR-EMEA 2012 9 3114.32000 450.00000 0.00000 450.00000 3564.32000
Prof Fees & Services-HR-EMEA 2012 10 3564.32000 922.18000 450.00000 472.18000 4036.50000
Prof Fees & Services-HR-EMEA 2012 11 4036.50000 949.71000 485.00000 464.71000 4501.21000
Prof Fees & Services-HR-EMEA 2012 12 4501.21000 427.19000 0.00000 427.19000 4928.40000
Recruitment-HR-EMEA 2012 6 0.00000 10800.00000 300.00000 10500.00000 10500.00000
Recruitment-HR-EMEA 2012 7 10500.00000 11700.00000 22200.00000 -10500.00000 0.00000
Salaries-Exec/Admin-EMEA 2012 7 0.00000 1333.33000 0.00000 1333.33000 1333.33000
Salaries-Exec/Admin-EMEA 2012 8 1333.33000 1333.33000 0.00000 1333.33000 2666.66000
Salaries-Exec/Admin-EMEA 2012 9 2666.66000 1333.33000 0.00000 1333.33000 3999.99000
Salaries-Exec/Admin-EMEA 2012 10 3999.99000 1333.33000 0.00000 1333.33000 5333.32000
Salaries-Exec/Admin-EMEA 2012 11 5333.32000 1333.33000 0.00000 1333.33000 6666.65000
Salaries-Exec/Admin-EMEA 2012 12 6666.65000 1046.15000 0.00000 1046.15000 7712.80000
Overtime-Exec/Admin-EMEA 2012 8 0.00000 32.84000 0.00000 32.84000 32.84000
Overtime-Exec/Admin-EMEA 2012 9 32.84000 279.14000 311.98000 -32.84000 0.00000
Holiday-Exec/Admin-EMEA 2012 12 0.00000 123.08000 0.00000 123.08000 123.08000
ER Payroll Taxes-Exec/Admin-EMEA 2012 7 0.00000 97.89000 0.00000 97.89000 97.89000
ER Payroll Taxes-Exec/Admin-EMEA 2012 8 97.89000 102.42000 0.00000 102.42000 200.31000
ER Payroll Taxes-Exec/Admin-EMEA 2012 9 200.31000 136.41000 0.00000 136.41000 336.72000
ER Payroll Taxes-Exec/Admin-EMEA 2012 10 336.72000 97.89000 0.00000 97.89000 434.61000
ER Payroll Taxes-Exec/Admin-EMEA 2012 11 434.61000 97.89000 0.00000 97.89000 532.50000
ER Payroll Taxes-Exec/Admin-EMEA 2012 12 532.50000 75.24000 0.00000 75.24000 607.74000
Employee Relations-Exec/Admin-EMEA 2012 1 0.00000 26.78000 0.00000 26.78000 26.78000
Employee Relations-Exec/Admin-EMEA 2012 3 26.78000 3296.40000 0.00000 3296.40000 3323.18000
Employee Relations-Exec/Admin-EMEA 2012 4 3323.18000 14.26000 0.00000 14.26000 3337.44000
Employee Relations-Exec/Admin-EMEA 2012 5 3337.44000 78.40000 0.00000 78.40000 3415.84000
Employee Relations-Exec/Admin-EMEA 2012 6 3415.84000 81.50000 0.00000 81.50000 3497.34000
Employee Relations-Exec/Admin-EMEA 2012 7 3497.34000 787.64000 0.00000 787.64000 4284.98000
Employee Relations-Exec/Admin-EMEA 2012 8 4284.98000 130.02000 0.00000 130.02000 4415.00000
Employee Relations-Exec/Admin-EMEA 2012 10 4415.00000 326.94000 0.00000 326.94000 4741.94000
Employee Relations-Exec/Admin-EMEA 2012 11 4741.94000 518.36000 0.00000 518.36000 5260.30000
Employee Relations-Exec/Admin-EMEA 2012 12 5260.30000 39.55000 0.00000 39.55000 5299.85000
Travel-Exec/Admin-EMEA 2012 1 0.00000 6.60000 0.00000 6.60000 6.60000
Travel-Exec/Admin-EMEA 2012 2 6.60000 37.99000 0.00000 37.99000 44.59000
Travel-Exec/Admin-EMEA 2012 3 44.59000 388.50000 0.00000 388.50000 433.09000
Travel-Exec/Admin-EMEA 2012 4 433.09000 0.00000 433.09000 -433.09000 0.00000
Travel-Lodging-Exec/Admin-EMEA 2012 8 0.00000 5.94000 0.00000 5.94000 5.94000
Travel-Lodging-Exec/Admin-EMEA 2012 11 5.94000 111.49000 111.49000 0.00000 5.94000
Travel-Lodging-Exec/Admin-EMEA 2012 12 5.94000 1581.10000 1581.10000 0.00000 5.94000
Food-Exec/Admin-EMEA 2012 1 0.00000 91.26000 0.00000 91.26000 91.26000
Food-Exec/Admin-EMEA 2012 2 91.26000 83.72000 0.00000 83.72000 174.98000
Food-Exec/Admin-EMEA 2012 3 174.98000 104.27000 0.00000 104.27000 279.25000
Food-Exec/Admin-EMEA 2012 4 279.25000 196.12000 0.00000 196.12000 475.37000
Food-Exec/Admin-EMEA 2012 5 475.37000 492.78000 0.00000 492.78000 968.15000
Food-Exec/Admin-EMEA 2012 6 968.15000 88.62000 0.00000 88.62000 1056.77000
Food-Exec/Admin-EMEA 2012 7 1056.77000 279.25000 0.00000 279.25000 1336.02000
Food-Exec/Admin-EMEA 2012 8 1336.02000 156.40000 0.00000 156.40000 1492.42000
Food-Exec/Admin-EMEA 2012 9 1492.42000 315.70000 0.00000 315.70000 1808.12000
Food-Exec/Admin-EMEA 2012 10 1808.12000 289.60000 0.00000 289.60000 2097.72000
Food-Exec/Admin-EMEA 2012 11 2097.72000 115.02000 0.00000 115.02000 2212.74000
Food-Exec/Admin-EMEA 2012 12 2212.74000 311.79000 0.00000 311.79000 2524.53000
Exec/Admin-Postage 2012 1 0.00000 247.58000 10.91000 236.67000 236.67000
Exec/Admin-Postage 2012 2 236.67000 267.04000 14.20000 252.84000 489.51000
Exec/Admin-Postage 2012 3 489.51000 464.51000 5.79000 458.72000 948.23000
Exec/Admin-Postage 2012 4 948.23000 576.22000 4.76000 571.46000 1519.69000
Exec/Admin-Postage 2012 5 1519.69000 374.63000 68.65000 305.98000 1825.67000
Exec/Admin-Postage 2012 6 1825.67000 412.30000 0.00000 412.30000 2237.97000
Exec/Admin-Postage 2012 7 2237.97000 831.14000 0.00000 831.14000 3069.11000
Exec/Admin-Postage 2012 8 3069.11000 1117.92000 0.00000 1117.92000 4187.03000
Exec/Admin-Postage 2012 9 4187.03000 1348.88000 45.51000 1303.37000 5490.40000
Exec/Admin-Postage 2012 10 5490.40000 3231.30000 4.02000 3227.28000 8717.68000
Exec/Admin-Postage 2012 11 8717.68000 2744.40000 0.00000 2744.40000 11462.08000
Exec/Admin-Postage 2012 12 11462.08000 3163.65000 0.00000 3163.65000 14625.73000
Insurance-Exec/Admin-EMEA 2012 1 0.00000 323.00000 0.00000 323.00000 323.00000
Insurance-Exec/Admin-EMEA 2012 2 323.00000 323.00000 0.00000 323.00000 646.00000
Insurance-Exec/Admin-EMEA 2012 3 646.00000 323.00000 0.00000 323.00000 969.00000
Insurance-Exec/Admin-EMEA 2012 4 969.00000 323.00000 0.00000 323.00000 1292.00000
Insurance-Exec/Admin-EMEA 2012 5 1292.00000 323.00000 0.00000 323.00000 1615.00000
Insurance-Exec/Admin-EMEA 2012 6 1615.00000 323.00000 0.00000 323.00000 1938.00000
Insurance-Exec/Admin-EMEA 2012 7 1938.00000 323.00000 0.00000 323.00000 2261.00000
Insurance-Exec/Admin-EMEA 2012 8 2261.00000 323.00000 0.00000 323.00000 2584.00000
Supplies - Office - Printing-Exec/Admin-EMEA 2012 1 0.00000 2140.53000 210.43000 1930.10000 1930.10000
Supplies - Office - Printing-Exec/Admin-EMEA 2012 2 1930.10000 1870.23000 179.70000 1690.53000 3620.63000
Supplies - Office - Printing-Exec/Admin-EMEA 2012 3 3620.63000 3382.24000 927.10000 2455.14000 6075.77000
Supplies - Office - Printing-Exec/Admin-EMEA 2012 4 6075.77000 3507.10000 1393.25000 2113.85000 8189.62000
Supplies - Office - Printing-Exec/Admin-EMEA 2012 5 8189.62000 3024.16000 259.93000 2764.23000 10953.85000
Supplies - Office - Printing-Exec/Admin-EMEA 2012 6 10953.85000 2967.75000 0.00000 2967.75000 13921.60000
Supplies - Office - Printing-Exec/Admin-EMEA 2012 7 13921.60000 5538.41000 375.26000 5163.15000 19084.75000
Supplies - Office - Printing-Exec/Admin-EMEA 2012 8 19084.75000 2453.31000 1.96000 2451.35000 21536.10000
Supplies - Office - Printing-Exec/Admin-EMEA 2012 9 21536.10000 2461.37000 1108.87000 1352.50000 22888.60000
Supplies - Office - Printing-Exec/Admin-EMEA 2012 10 22888.60000 8368.05000 0.00000 8368.05000 31256.65000
Supplies - Office - Printing-Exec/Admin-EMEA 2012 11 31256.65000 2407.34000 0.00000 2407.34000 33663.99000
Supplies - Office - Printing-Exec/Admin-EMEA 2012 12 33663.99000 6302.41000 4681.20000 1621.21000 35285.20000
Membership Dues & Fees-Exec/Admin-EMEA 2012 1 0.00000 35.00000 0.00000 35.00000 35.00000
Membership Dues & Fees-Exec/Admin-EMEA 2012 4 35.00000 235.24000 0.00000 235.24000 270.24000
Membership Dues & Fees-Exec/Admin-EMEA 2012 7 270.24000 61.00000 0.00000 61.00000 331.24000
Other Income / Expense-Exec/Admin-EMEA 2012 1 0.00000 97.60000 0.00000 97.60000 97.60000
Other Income / Expense-Exec/Admin-EMEA 2012 2 97.60000 30.00000 0.00000 30.00000 127.60000
Other Income / Expense-Exec/Admin-EMEA 2012 3 127.60000 193.78000 0.00000 193.78000 321.38000
Other Income / Expense-Exec/Admin-EMEA 2012 4 321.38000 0.00000 321.38000 -321.38000 0.00000
Federal Income Tax--EMEA 2012 4 0.00000 24589.44000 24589.44000 0.00000 0.00000
Deferred Income Taxes-EMEA 2012 7 0.00000 0.00000 72235.00000 -72235.00000 -72235.00000
Deferred Income Taxes-EMEA 2012 9 -72235.00000 11371.00000 0.00000 11371.00000 -60864.00000
Deferred Income Taxes-EMEA 2012 12 -60864.00000 1110.00000 0.00000 1110.00000 -59754.00000
Realized Currency Exchange (Gain) Loss-EMEA 2012 1 0.00000 0.00000 172.00000 -172.00000 -172.00000
Realized Currency Exchange (Gain) Loss-EMEA 2012 2 -172.00000 0.00000 168.46000 -168.46000 -340.46000
Realized Currency Exchange (Gain) Loss-EMEA 2012 3 -340.46000 0.00000 51.50000 -51.50000 -391.96000
Realized Currency Exchange (Gain) Loss-EMEA 2012 4 -391.96000 119.79000 0.00000 119.79000 -272.17000
Realized Currency Exchange (Gain) Loss-EMEA 2012 5 -272.17000 293.29000 3.34000 289.95000 17.78000
Realized Currency Exchange (Gain) Loss-EMEA 2012 6 17.78000 138.45000 0.00000 138.45000 156.23000
Realized Currency Exchange (Gain) Loss-EMEA 2012 7 156.23000 8.46000 0.00000 8.46000 164.69000
Realized Currency Exchange (Gain) Loss-EMEA 2012 8 164.69000 0.00000 272.53000 -272.53000 -107.84000
Realized Currency Exchange (Gain) Loss-EMEA 2012 9 -107.84000 74.83000 59.06000 15.77000 -92.07000
Realized Currency Exchange (Gain) Loss-EMEA 2012 10 -92.07000 308.84000 0.13000 308.71000 216.64000
Realized Currency Exchange (Gain) Loss-EMEA 2012 11 216.64000 414.41000 119.79000 294.62000 511.26000
Realized Currency Exchange (Gain) Loss-EMEA 2012 12 511.26000 8.02000 168.86000 -160.84000 350.42000
Un-realized Curr Exchange (Gain) Loss--EMEA 2012 7 0.00000 0.01000 0.00000 0.01000 0.01000
Un-realized Curr Exchange (Gain) Loss--EMEA 2012 8 0.01000 0.00000 366.36000 -366.36000 -366.35000
Un-realized Curr Exchange (Gain) Loss--EMEA 2012 9 -366.35000 9.46000 0.00000 9.46000 -356.89000
Un-realized Curr Exchange (Gain) Loss--EMEA 2012 10 -356.89000 0.00000 49.90000 -49.90000 -406.79000
Un-realized Curr Exchange (Gain) Loss--EMEA 2012 11 -406.79000 0.00000 343.62000 -343.62000 -750.41000
Un-realized Curr Exchange (Gain) Loss--EMEA 2012 12 -750.41000 0.10000 127.67000 -127.57000 -877.98000
Other Income / Expense--EMEA 2012 1 0.00000 0.00000 30.00000 -30.00000 -30.00000
Other Income / Expense--EMEA 2012 4 -30.00000 0.00000 20.00000 -20.00000 -50.00000
Other Income / Expense--EMEA 2012 5 -50.00000 0.00000 20.00000 -20.00000 -70.00000
Other Income / Expense--EMEA 2012 8 -70.00000 0.00000 10.00000 -10.00000 -80.00000
Other Income / Expense--EMEA 2012 9 -80.00000 0.00000 10.00000 -10.00000 -90.00000
Other Income / Expense--EMEA 2012 10 -90.00000 0.00000 13.46000 -13.46000 -103.46000
Employee Relations-General EMEA -Other Dir 2012 1 0.00000 64.21000 0.00000 64.21000 64.21000
Employee Relations-General EMEA -Other Dir 2012 3 64.21000 129.31000 0.00000 129.31000 193.52000
Employee Relations-General EMEA -Other Dir 2012 4 193.52000 117.60000 0.00000 117.60000 311.12000
Employee Relations-General EMEA -Other Dir 2012 5 311.12000 329.80000 0.00000 329.80000 640.92000
Employee Relations-General EMEA -Other Dir 2012 6 640.92000 84.95000 0.00000 84.95000 725.87000
Employee Relations-General EMEA -Other Dir 2012 7 725.87000 415.08000 30.00000 385.08000 1110.95000
Employee Relations-General EMEA -Other Dir 2012 8 1110.95000 483.37000 0.00000 483.37000 1594.32000
Employee Relations-General EMEA -Other Dir 2012 9 1594.32000 164.35000 0.00000 164.35000 1758.67000
Employee Relations-General EMEA -Other Dir 2012 10 1758.67000 82.46000 41.23000 41.23000 1799.90000
Employee Relations-General EMEA -Other Dir 2012 11 1799.90000 83.48000 0.00000 83.48000 1883.38000
Employee Relations-General EMEA -Other Dir 2012 12 1883.38000 827.40000 0.00000 827.40000 2710.78000
Travel-General EMEA Other Dir 2012 1 0.00000 115.70000 0.00000 115.70000 115.70000
Travel-General EMEA Other Dir 2012 2 115.70000 709.90000 0.00000 709.90000 825.60000
Travel-General EMEA Other Dir 2012 3 825.60000 437.20000 0.00000 437.20000 1262.80000
Travel-General EMEA Other Dir 2012 4 1262.80000 6.60000 0.00000 6.60000 1269.40000
Travel-General EMEA Other Dir 2012 5 1269.40000 207.00000 0.00000 207.00000 1476.40000
Travel-General EMEA Other Dir 2012 6 1476.40000 147.80000 27.80000 120.00000 1596.40000
Travel-General EMEA Other Dir 2012 7 1596.40000 309.00000 0.00000 309.00000 1905.40000
Travel-General EMEA Other Dir 2012 8 1905.40000 77.80000 0.00000 77.80000 1983.20000
Travel-General EMEA Other Dir 2012 12 1983.20000 192.60000 0.00000 192.60000 2175.80000
Travel-Lodging-General EMEA Other Dir 2012 2 0.00000 243.11000 0.00000 243.11000 243.11000
Travel-Lodging-General EMEA Other Dir 2012 3 243.11000 267.90000 0.00000 267.90000 511.01000
Travel-Subsistence-General EMEA Other Dir 2012 1 0.00000 5.40000 0.00000 5.40000 5.40000
Travel-Subsistence-General EMEA Other Dir 2012 2 5.40000 130.96000 0.00000 130.96000 136.36000
Travel-Subsistence-General EMEA Other Dir 2012 3 136.36000 14.76000 0.00000 14.76000 151.12000
Travel-Subsistence-General EMEA Other Dir 2012 7 151.12000 17.43000 0.00000 17.43000 168.55000
Telephone-General EMEA Other Dir 2012 1 0.00000 61.23000 0.00000 61.23000 61.23000
Telephone-General EMEA Other Dir 2012 2 61.23000 74.36000 0.00000 74.36000 135.59000
Telephone-General EMEA Other Dir 2012 3 135.59000 66.38000 0.00000 66.38000 201.97000
Telephone-General EMEA Other Dir 2012 4 201.97000 84.59000 11.50000 73.09000 275.06000
Telephone-General EMEA Other Dir 2012 5 275.06000 31.95000 0.00000 31.95000 307.01000
Telephone-General EMEA Other Dir 2012 6 307.01000 30.00000 0.00000 30.00000 337.01000
Telephone-General EMEA Other Dir 2012 7 337.01000 39.07000 0.00000 39.07000 376.08000
Telephone-General EMEA Other Dir 2012 8 376.08000 30.00000 0.00000 30.00000 406.08000
Telephone-General EMEA Other Dir 2012 9 406.08000 30.00000 0.00000 30.00000 436.08000
Telephone-General EMEA Other Dir 2012 10 436.08000 41.50000 0.00000 41.50000 477.58000
Telephone-General EMEA Other Dir 2012 11 477.58000 31.00000 0.00000 31.00000 508.58000
Telephone-General EMEA Other Dir 2012 12 508.58000 31.00000 0.00000 31.00000 539.58000
Revenue-General EMEA 2012 1 0.00000 12492.00000 306745.00000 -294253.00000 -294253.00000
Revenue-General EMEA 2012 2 -294253.00000 15264.20000 347901.20000 -332637.00000 -626890.00000
Revenue-General EMEA 2012 3 -626890.00000 11710.00000 288796.00000 -277086.00000 -903976.00000
Revenue-General EMEA 2012 4 -903976.00000 54255.00000 413013.00000 -358758.00000 -1262734.00000
Revenue-General EMEA 2012 5 -1262734.00000 13759.00000 342102.00000 -328343.00000 -1591077.00000
Revenue-General EMEA 2012 6 -1591077.00000 12695.00000 507569.00000 -494874.00000 -2085951.00000
Revenue-General EMEA 2012 7 -2085951.00000 14759.00000 515872.16000 -501113.16000 -2587064.16000
Revenue-General EMEA 2012 8 -2587064.16000 14920.90000 692500.12000 -677579.22000 -3264643.38000
Revenue-General EMEA 2012 9 -3264643.38000 14798.00000 517208.94000 -502410.94000 -3767054.32000
Revenue-General EMEA 2012 10 -3767054.32000 13474.69000 510566.55000 -497091.86000 -4264146.18000
Revenue-General EMEA 2012 11 -4264146.18000 13620.40000 439812.26000 -426191.86000 -4690338.04000
Revenue-General EMEA 2012 12 -4690338.04000 28846.00000 394929.85000 -366083.85000 -5056421.89000
IC Revenue-Gen EMEA- HR LLC 3211 2012 1 0.00000 0.00000 8429.00000 -8429.00000 -8429.00000
IC Revenue-Gen EMEA- HR LLC 3211 2012 2 -8429.00000 0.00000 8410.00000 -8410.00000 -16839.00000
IC Revenue-Gen EMEA- HR LLC 3211 2012 3 -16839.00000 0.00000 8130.00000 -8130.00000 -24969.00000
IC Revenue-Gen EMEA- HR LLC 3211 2012 4 -24969.00000 0.00000 7550.00000 -7550.00000 -32519.00000
IC Revenue-Gen EMEA- HR LLC 3211 2012 5 -32519.00000 0.00000 10831.00000 -10831.00000 -43350.00000
IC Revenue-Gen EMEA- HR LLC 3211 2012 6 -43350.00000 0.00000 8657.00000 -8657.00000 -52007.00000
IC Revenue-Gen EMEA- HR LLC 3211 2012 7 -52007.00000 0.00000 10002.00000 -10002.00000 -62009.00000
IC Revenue-Gen EMEA- HR LLC 3211 2012 8 -62009.00000 0.00000 10592.00000 -10592.00000 -72601.00000
IC Revenue-Gen EMEA- HR LLC 3211 2012 9 -72601.00000 0.00000 8331.00000 -8331.00000 -80932.00000
IC Revenue-Gen EMEA- HR LLC 3211 2012 10 -80932.00000 0.00000 8861.00000 -8861.00000 -89793.00000
IC Revenue-Gen EMEA- HR LLC 3211 2012 11 -89793.00000 0.00000 9060.00000 -9060.00000 -98853.00000
IC Revenue-Gen EMEA- HR LLC 3211 2012 12 -98853.00000 0.00000 7898.00000 -7898.00000 -106751.00000
IC Revenue-Gen EMEA-HR Ltd 4501 2012 1 0.00000 0.00000 305.00000 -305.00000 -305.00000
IC Revenue-Gen EMEA-HR Ltd 4501 2012 2 -305.00000 26.00000 156.00000 -130.00000 -435.00000
Operations-Direct-Amortization-Intangible 2012 1 0.00000 14905.79000 0.00000 14905.79000 14905.79000
Operations-Direct-Amortization-Intangible 2012 2 14905.79000 14905.79000 0.00000 14905.79000 29811.58000
Operations-Direct-Amortization-Intangible 2012 3 29811.58000 14905.79000 0.00000 14905.79000 44717.37000
Operations-Direct-Amortization-Intangible 2012 4 44717.37000 14905.79000 0.00000 14905.79000 59623.16000
Operations-Direct-Amortization-Intangible 2012 5 59623.16000 14905.79000 0.00000 14905.79000 74528.95000
Operations-Direct-Amortization-Intangible 2012 6 74528.95000 14905.79000 0.00000 14905.79000 89434.74000
Operations-Direct-Amortization-Intangible 2012 7 89434.74000 14905.79000 0.00000 14905.79000 104340.53000
Operations-Direct-Amortization-Intangible 2012 8 104340.53000 14905.79000 0.00000 14905.79000 119246.32000
Operations-Direct-Amortization-Intangible 2012 9 119246.32000 14905.79000 0.00000 14905.79000 134152.11000
Operations-Direct-Amortization-Intangible 2012 10 134152.11000 14905.79000 0.00000 14905.79000 149057.90000
Operations-Direct-Amortization-Intangible 2012 11 149057.90000 14905.79000 0.00000 14905.79000 163963.69000
Operations-Direct-Amortization-Intangible 2012 12 163963.69000 14905.79000 0.00000 14905.79000 178869.48000
Operations-Direct-Depreciation Exp-F&F 2012 1 0.00000 2790.58000 0.00000 2790.58000 2790.58000
Operations-Direct-Depreciation Exp-F&F 2012 2 2790.58000 2809.07000 0.00000 2809.07000 5599.65000
Operations-Direct-Depreciation Exp-F&F 2012 3 5599.65000 2865.71000 0.00000 2865.71000 8465.36000
Operations-Direct-Depreciation Exp-F&F 2012 4 8465.36000 2948.91000 0.00000 2948.91000 11414.27000
Operations-Direct-Depreciation Exp-F&F 2012 5 11414.27000 2955.53000 0.00000 2955.53000 14369.80000
Operations-Direct-Depreciation Exp-F&F 2012 6 14369.80000 2848.02000 0.00000 2848.02000 17217.82000
Operations-Direct-Depreciation Exp-F&F 2012 7 17217.82000 2825.42000 0.00000 2825.42000 20043.24000
Operations-Direct-Depreciation Exp-F&F 2012 8 20043.24000 2825.43000 0.00000 2825.43000 22868.67000
Operations-Direct-Depreciation Exp-F&F 2012 9 22868.67000 2825.42000 0.00000 2825.42000 25694.09000
Operations-Direct-Depreciation Exp-F&F 2012 10 25694.09000 2825.42000 0.00000 2825.42000 28519.51000
Operations-Direct-Depreciation Exp-F&F 2012 11 28519.51000 2825.42000 0.00000 2825.42000 31344.93000
Operations-Direct-Depreciation Exp-F&F 2012 12 31344.93000 2825.42000 0.00000 2825.42000 34170.35000
Operations-Direct-Depreciation Exp Equipt 2012 1 0.00000 3744.02000 0.00000 3744.02000 3744.02000
Operations-Direct-Depreciation Exp Equipt 2012 2 3744.02000 3806.59000 0.00000 3806.59000 7550.61000
Operations-Direct-Depreciation Exp Equipt 2012 3 7550.61000 4026.97000 0.00000 4026.97000 11577.58000
Operations-Direct-Depreciation Exp Equipt 2012 4 11577.58000 3979.65000 0.00000 3979.65000 15557.23000
Operations-Direct-Depreciation Exp Equipt 2012 5 15557.23000 4006.12000 0.00000 4006.12000 19563.35000
Operations-Direct-Depreciation Exp Equipt 2012 6 19563.35000 4339.22000 0.00000 4339.22000 23902.57000
Operations-Direct-Depreciation Exp Equipt 2012 7 23902.57000 4466.98000 0.00000 4466.98000 28369.55000
Operations-Direct-Depreciation Exp Equipt 2012 8 28369.55000 22759.26000 0.00000 22759.26000 51128.81000
Operations-Direct-Depreciation Exp Equipt 2012 9 51128.81000 23276.51000 0.00000 23276.51000 74405.32000
Operations-Direct-Depreciation Exp Equipt 2012 10 74405.32000 22996.91000 0.00000 22996.91000 97402.23000
Operations-Direct-Depreciation Exp Equipt 2012 11 97402.23000 24616.50000 0.00000 24616.50000 122018.73000
Operations-Direct-Depreciation Exp Equipt 2012 12 122018.73000 24375.28000 0.00000 24375.28000 146394.01000
Operations-Direct-Depreciation Exp-Comp Sftw 2012 12 0.00000 215.74000 0.00000 215.74000 215.74000
Finance-Corporation Tax 2012 4 0.00000 24589.44000 0.00000 24589.44000 24589.44000
Finance-Corporation Tax 2012 7 24589.44000 11500.00000 202.00000 11298.00000 35887.44000
Finance-Corporation Tax 2012 8 35887.44000 24589.44000 30087.44000 -5498.00000 30389.44000
Finance-Corporation Tax 2012 9 30389.44000 0.00000 5771.00000 -5771.00000 24618.44000
Finance-Corporation Tax 2012 12 24618.44000 11015.00000 24643.44000 -13628.44000 10990.00000
Ops Indirect - Salaries 2012 1 0.00000 9241.03000 0.00000 9241.03000 9241.03000
Ops Indirect - Salaries 2012 2 9241.03000 12250.00000 0.00000 12250.00000 21491.03000
Ops Indirect - Salaries 2012 3 21491.03000 12319.30000 0.00000 12319.30000 33810.33000
Ops Indirect - Salaries 2012 4 33810.33000 12670.84000 0.00000 12670.84000 46481.17000
Ops Indirect - Salaries 2012 5 46481.17000 12616.99000 0.00000 12616.99000 59098.16000
Ops Indirect - Salaries 2012 6 59098.16000 12714.42000 0.00000 12714.42000 71812.58000
Ops Indirect - Salaries 2012 7 71812.58000 29266.66000 0.00000 29266.66000 101079.24000
Ops Indirect - Salaries 2012 8 101079.24000 25218.68000 0.00000 25218.68000 126297.92000
Ops Indirect - Salaries 2012 9 126297.92000 40138.43000 0.00000 40138.43000 166436.35000
Ops Indirect - Salaries 2012 10 166436.35000 27863.47000 0.00000 27863.47000 194299.82000
Ops Indirect - Salaries 2012 11 194299.82000 25969.03000 0.00000 25969.03000 220268.85000
Ops Indirect - Salaries 2012 12 220268.85000 28890.27000 0.00000 28890.27000 249159.12000
Ops Indirect - Overtime 2012 6 0.00000 271.14000 0.00000 271.14000 271.14000
Ops Indirect - Overtime 2012 7 271.14000 2519.85000 0.00000 2519.85000 2790.99000
Ops Indirect - Overtime 2012 8 2790.99000 3144.23000 0.00000 3144.23000 5935.22000
Ops Indirect - Overtime 2012 9 5935.22000 3160.80000 0.00000 3160.80000 9096.02000
Ops Indirect - Overtime 2012 10 9096.02000 3553.56000 0.00000 3553.56000 12649.58000
Ops Indirect - Overtime 2012 11 12649.58000 1448.42000 0.00000 1448.42000 14098.00000
Ops Indirect - Overtime 2012 12 14098.00000 1044.00000 0.00000 1044.00000 15142.00000
Ops Indirect - Bonus Expense 2012 1 0.00000 1666.67000 0.00000 1666.67000 1666.67000
Ops Indirect - Bonus Expense 2012 2 1666.67000 1666.67000 0.00000 1666.67000 3333.34000
Ops Indirect - Bonus Expense 2012 3 3333.34000 5059.46000 5000.01000 59.45000 3392.79000
Ops Indirect - Bonus Expense 2012 4 3392.79000 1108.96000 0.00000 1108.96000 4501.75000
Ops Indirect - Bonus Expense 2012 5 4501.75000 1478.91000 0.00000 1478.91000 5980.66000
Ops Indirect - Bonus Expense 2012 6 5980.66000 1913.88000 0.00000 1913.88000 7894.54000
Ops Indirect - Bonus Expense 2012 7 7894.54000 0.00000 6221.44000 -6221.44000 1673.10000
Ops Indirect - Bonus Expense 2012 8 1673.10000 410.37000 0.00000 410.37000 2083.47000
Ops Indirect - Bonus Expense 2012 9 2083.47000 399.82000 0.00000 399.82000 2483.29000
Ops Indirect - Bonus Expense 2012 10 2483.29000 388.40000 0.00000 388.40000 2871.69000
Ops Indirect - Bonus Expense 2012 11 2871.69000 5942.88000 0.00000 5942.88000 8814.57000
Ops Indirect - Bonus Expense 2012 12 8814.57000 316.34000 0.00000 316.34000 9130.91000
Ops Indirect - ER Payroll Taxes 2012 1 0.00000 1342.69000 0.00000 1342.69000 1342.69000
Ops Indirect - ER Payroll Taxes 2012 2 1342.69000 1676.63000 0.00000 1676.63000 3019.32000
Ops Indirect - ER Payroll Taxes 2012 3 3019.32000 4914.41000 3450.00000 1464.41000 4483.73000
Ops Indirect - ER Payroll Taxes 2012 4 4483.73000 1657.75000 0.00000 1657.75000 6141.48000
Ops Indirect - ER Payroll Taxes 2012 5 6141.48000 1701.37000 0.00000 1701.37000 7842.85000
Ops Indirect - ER Payroll Taxes 2012 6 7842.85000 1812.27000 0.00000 1812.27000 9655.12000
Ops Indirect - ER Payroll Taxes 2012 7 9655.12000 3267.05000 858.56000 2408.49000 12063.61000
Ops Indirect - ER Payroll Taxes 2012 8 12063.61000 2937.33000 0.00000 2937.33000 15000.94000
Ops Indirect - ER Payroll Taxes 2012 9 15000.94000 3012.90000 0.00000 3012.90000 18013.84000
Ops Indirect - ER Payroll Taxes 2012 10 18013.84000 2636.89000 0.00000 2636.89000 20650.73000
Ops Indirect - ER Payroll Taxes 2012 11 20650.73000 3041.14000 0.00000 3041.14000 23691.87000
Ops Indirect - ER Payroll Taxes 2012 12 23691.87000 2422.33000 0.00000 2422.33000 26114.20000
Ops Indirect - Health Insurance 2012 9 0.00000 344.00000 0.00000 344.00000 344.00000
Ops Indirect - Health Insurance 2012 10 344.00000 91.65000 0.00000 91.65000 435.65000
Ops Indirect - Health Insurance 2012 11 435.65000 109.00000 0.00000 109.00000 544.65000
Ops Indirect - Health Insurance 2012 12 544.65000 108.96000 0.00000 108.96000 653.61000
Ops Indirect - Pension 2012 11 0.00000 1868.00000 0.00000 1868.00000 1868.00000
Ops Indirect - Pension 2012 12 1868.00000 93.33000 0.00000 93.33000 1961.33000
Customer Service - Salaries 2012 2 0.00000 2420.50000 0.00000 2420.50000 2420.50000
Customer Service - Salaries 2012 3 2420.50000 2574.35000 0.00000 2574.35000 4994.85000
Customer Service - Salaries 2012 4 4994.85000 2708.46000 0.00000 2708.46000 7703.31000
Customer Service - Salaries 2012 5 7703.31000 2595.65000 0.00000 2595.65000 10298.96000
Customer Service - Salaries 2012 6 10298.96000 1322.10000 0.00000 1322.10000 11621.06000
Customer Service - Salaries 2012 7 11621.06000 1353.33000 0.00000 1353.33000 12974.39000
Customer Service - Salaries 2012 8 12974.39000 1290.87000 0.00000 1290.87000 14265.26000
Customer Service - Salaries 2012 9 14265.26000 2906.51000 0.00000 2906.51000 17171.77000
Customer Service - Salaries 2012 10 17171.77000 5832.50000 0.00000 5832.50000 23004.27000
Customer Service - Salaries 2012 11 23004.27000 5011.99000 0.00000 5011.99000 28016.26000
Customer Service - Salaries 2012 12 28016.26000 4165.83000 0.00000 4165.83000 32182.09000
Customer Service - Overtime 2012 9 0.00000 470.88000 0.00000 470.88000 470.88000
Customer Service - Overtime 2012 10 470.88000 980.96000 0.00000 980.96000 1451.84000
Customer Service - Overtime 2012 11 1451.84000 896.22000 0.00000 896.22000 2348.06000
Customer Service - Overtime 2012 12 2348.06000 180.62000 0.00000 180.62000 2528.68000
Customer Service-Bonus 2012 10 0.00000 565.23000 0.00000 565.23000 565.23000
Customer Service-Holiday 2012 9 0.00000 0.00000 62.46000 -62.46000 -62.46000
Customer Service-Holiday 2012 11 -62.46000 423.06000 0.00000 423.06000 360.60000
Customer Service-ER Payroll Taxes 2012 2 0.00000 171.45000 0.00000 171.45000 171.45000
Customer Service-ER Payroll Taxes 2012 3 171.45000 192.68000 0.00000 192.68000 364.13000
Customer Service-ER Payroll Taxes 2012 4 364.13000 211.19000 0.00000 211.19000 575.32000
Customer Service-ER Payroll Taxes 2012 5 575.32000 195.62000 0.00000 195.62000 770.94000
Customer Service-ER Payroll Taxes 2012 6 770.94000 101.16000 0.00000 101.16000 872.10000
Customer Service-ER Payroll Taxes 2012 7 872.10000 100.65000 0.00000 100.65000 972.75000
Customer Service-ER Payroll Taxes 2012 8 972.75000 92.03000 0.00000 92.03000 1064.78000
Customer Service-ER Payroll Taxes 2012 9 1064.78000 200.31000 0.00000 200.31000 1265.09000
Customer Service-ER Payroll Taxes 2012 10 1265.09000 759.91000 0.00000 759.91000 2025.00000
Customer Service-ER Payroll Taxes 2012 11 2025.00000 615.37000 0.00000 615.37000 2640.37000
Customer Service-ER Payroll Taxes 2012 12 2640.37000 427.58000 0.00000 427.58000 3067.95000
mmmmm, that data wasn't what I thought it was - sorry. I had thought I could use it to reconcile to that image but, well, I can't get it to do that. I assume this won't matter as you will test it on true data anyway.
Anyway, I did create some data from that big text paste which is as follows:
Once sample data exists, ideally there is an "expected result" that we are to meet. Regrettably because the data is reverse engineered from the result this is messed up. Anyway, this is the result I get from the sample data:
This is the query that produces all the years and periods, i.e. I believe this is what you have been seeking.
Anyway, I did create some data from that big text paste which is as follows:
CREATE TABLE GL10111
    ([ACTINDX] int, [YEAR1] int, [PERIODID] int, [PERDBLNC] int, [DEBITAMT] int, [CRDTAMNT] numeric)
;

INSERT INTO GL10111
    ([ACTINDX], [YEAR1], [PERIODID], [PERDBLNC], [DEBITAMT], [CRDTAMNT])
VALUES
    (101, 2012, 0, 0.00000, 0.00000, 0.00000),
    (101, 2012, 2, 209805.93000, 2981.25000, 0.00000),
    (101, 2012, 3, 212787.18000, 10588.96000, 0.00000),
    (101, 2012, 5, 223376.14000, 1271.27000, 0.00000),
    (101, 2012, 6, 224647.41000, 19276.91000, 180.00000),
    (101, 2012, 7, 243744.32000, 103082.67000, 108551.38000),
    (101, 2012, 8, 238275.61000, 891453.40000, 0.00000),
    (101, 2012, 11, 1129729.01000, 80916.17000, 0.00000),
    (101, 2012, 12, 1210645.18000, 65161.03000, 71274.46000)
;


CREATE TABLE GL00100
    ([ACTDESCR] varchar(16), [ACTINDX] int)
;

INSERT INTO GL00100
    ([ACTDESCR], [ACTINDX])
VALUES
    ('Office Equipment', 101)
;


CREATE TABLE GL00105
    ([ACTNUMST] int, [ACTINDX] int)
;

INSERT INTO GL00105
    ([ACTNUMST], [ACTINDX])
VALUES
    (99, 101)
;Once sample data exists, ideally there is an "expected result" that we are to meet. Regrettably because the data is reverse engineered from the result this is messed up. Anyway, this is the result I get from the sample data:
| Account Index | Year | Period | Opening Balance |  Debit | Credit | Net Change | Ending Balance | Account | Account Description |
|---------------|------|--------|-----------------|--------|--------|------------|----------------|---------|---------------------|
|           101 | 2012 |      0 |               0 |      0 |      0 |          0 |              0 |      99 |    Office Equipment |
|           101 | 2012 |      1 |               0 |      0 |      0 |          0 |              0 |      99 |    Office Equipment |
|           101 | 2012 |      2 |         -206824 |   2981 |      0 |       2981 |        -203843 |      99 |    Office Equipment |
|           101 | 2012 |      3 |         -194593 |  10588 |      0 |      10588 |        -184005 |      99 |    Office Equipment |
|           101 | 2012 |      4 |               0 |      0 |      0 |          0 |              0 |      99 |    Office Equipment |
|           101 | 2012 |      5 |         -243723 |   1271 |      0 |       1271 |        -242452 |      99 |    Office Equipment |
|           101 | 2012 |      6 |         -176236 |  19276 |    180 |      19096 |        -157140 |      99 |    Office Equipment |
|           101 | 2012 |      7 |         -375450 | 103082 | 108551 |      -5469 |        -380919 |      99 |    Office Equipment |
|           101 | 2012 |      8 |         5033427 | 891453 |      0 |     891453 |        5924880 |      99 |    Office Equipment |
|           101 | 2012 |      9 |               0 |      0 |      0 |          0 |              0 |      99 |    Office Equipment |
|           101 | 2012 |     10 |               0 |      0 |      0 |          0 |              0 |      99 |    Office Equipment |
|           101 | 2012 |     11 |        -5989057 |  80916 |      0 |      80916 |       -5908141 |      99 |    Office Equipment |
| 101 | 2012 | 12 | -7251701 | 65161 | 71274 | -6113 | -7257814 | 99 | Office Equipment |This is the query that produces all the years and periods, i.e. I believe this is what you have been seeking.
with y as (
           select 2012 as yno
        )
, p as (
           select 0 as pno union all
           select 1 as pno union all
           select 2 as pno union all
           select 3 as pno union all
           select 4 as pno union all
           select 5 as pno union all
           select 6 as pno union all
           select 7 as pno union all
           select 8 as pno union all
           select 9 as pno union all
           select 10 as pno union all
           select 11 as pno union all
           select 12 as pno
       )
SELECT
        GL.ACTINDX  AS [Account Index]
      , Y.YNO       AS [Year]
      , P.PNO       AS [Period]
      , isnull(CASE
                WHEN P.PNO = 0 THEN 0
                ELSE SUM(-GL10111.CRDTAMNT + GL10111.DEBITAMT + PREV.PERDBLNC - GL10111.PERDBLNC) - (GL10111.DEBITAMT - GL10111.CRDTAMNT)
        END,0)              AS [Opening Balance]
      , isnull(CASE
                WHEN P.PNO = 0 THEN 0
                ELSE GL10111.DEBITAMT
        END,0)              AS [Debit]
      , isnull(CASE
                WHEN P.PNO = 0  THEN 0
                ELSE GL10111.CRDTAMNT
        END,0)              AS [Credit]
      , isnull(CASE
                WHEN P.PNO = 0  THEN 0
                ELSE GL10111.DEBITAMT - GL10111.CRDTAMNT
        END,0)              AS [Net Change]
      , isnull(CASE
                WHEN P.PNO = 0 THEN GL10111.PERDBLNC
                ELSE SUM(-GL10111.CRDTAMNT + GL10111.DEBITAMT + PREV.PERDBLNC - GL10111.PERDBLNC)
        END,0)              AS [Ending Balance]
      , GL00105.ACTNUMST AS [Account]
      , GL00100.ACTDESCR AS [Account Description]
FROM y
CROSS JOIN p
INNER JOIN (SELECT DISTINCT
                ACTINDX, YEAR1
            FROM GL10111
            WHERE GL10111.YEAR1 = 2012
           ) GL ON y.yno = GL.YEAR1
        INNER JOIN GL00100 ON GL.ACTINDX = GL00100.ACTINDX
        INNER JOIN GL00105 ON GL.ACTINDX = GL00105.ACTINDX
        LEFT JOIN GL10111 ON GL.ACTINDX = GL10111.ACTINDX
                         AND y.yno = GL10111.YEAR1
                         AND p.pno = GL10111.PERIODID
        LEFT JOIN GL10111 AS PREV ON GL10111.ACTINDX = PREV.ACTINDX
                AND GL10111.YEAR1 = PREV.YEAR1
                AND GL10111.PERIODID >= PREV.PERIODID
GROUP BY
        GL.ACTINDX
      , Y.YNO
      , P.PNO
      , GL10111.DEBITAMT
      , GL10111.CRDTAMNT
      , GL10111.PERDBLNC
      , GL00105.ACTNUMST
      , GL00100.ACTDESCR
ORDER BY
        GL.ACTINDX
      , Y.YNO
      , P.PNO
;
ASKER
Hi Paul:
I get the following syntax errors, when I run the query:
Msg 4104, Level 16, State 1, Line 62
The multi-part identifier "Y.YNO" could not be bound.
Msg 4104, Level 16, State 1, Line 63
The multi-part identifier "P.PNO" could not be bound.
Msg 4104, Level 16, State 1, Line 21
The multi-part identifier "Y.YNO" could not be bound.
Msg 4104, Level 16, State 1, Line 22
The multi-part identifier "P.PNO" could not be bound.
Msg 4104, Level 16, State 1, Line 24
The multi-part identifier "P.PNO" could not be bound.
Msg 4104, Level 16, State 1, Line 28
The multi-part identifier "P.PNO" could not be bound.
Msg 4104, Level 16, State 1, Line 32
The multi-part identifier "P.PNO" could not be bound.
Msg 4104, Level 16, State 1, Line 36
The multi-part identifier "P.PNO" could not be bound.
Msg 4104, Level 16, State 1, Line 40
The multi-part identifier "P.PNO" could not be bound.
Msg 4104, Level 16, State 1, Line 71
The multi-part identifier "Y.YNO" could not be bound.
Msg 4104, Level 16, State 1, Line 72
The multi-part identifier "P.PNO" could not be bound.
John
ASKER
Hi Paul:
I figured out those syntax errors. Evidently, our SQL install is case-sensitive. For example, "Y.YNO" has to be typed as "y.yno".
This does get me all of the periods. Thanks!
But, for the periods with no activity, the Opening Balance should be pulling from the previous row's Ending Balance. And, for the periods with no activity, the Ending Balance should equal that Opening Balance.
Is there a way to modify this query to do this?
Thanks!
John
ASKER
For example, please see Period 1 in the screenshot below.
It should have 209805.93 for both Opening Balance and Ending Balance.
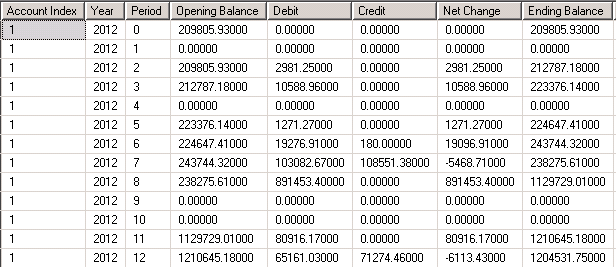
It should have 209805.93 for both Opening Balance and Ending Balance.
PLEASE give me the data ( for each table ) that relates to that last image (so that I can run a query)
PLEASE.
PLEASE.
ASKER
Hi Paul:
In order to get sample data posted, here, shall I simply follow the steps that you outlined earlier as shown below?
CREATE TABLE Table1
([AccountNo] varchar(4), [YearNo] int, [PeriodID] int, [Amount] int)
;
INSERT INTO Table1
([AccountNo], [YearNo], [PeriodID], [Amount])
VALUES
('abcd', 2015, 0, 1000000),
('abcd', 2015, 1, -25000),
('abcd', 2015, 1, 50000),
('abcd', 2015, 2, -25000),
('abcd', 2015, 2, 50000),
('abcd', 2015, 4, -25000),
('abcd', 2015, 4, 50000),
('abcd', 2015, 8, -25000),
('abcd', 2015, 8, 50000)
John
ASKER
Or, if this helps, below is the data that appears when I run the following query against the GL10111 table:
select * from GL10111 where ACTINDX = 1 and YEAR1 = 2012
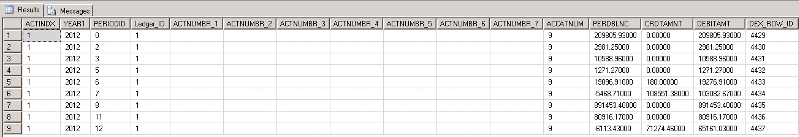
select * from GL10111 where ACTINDX = 1 and YEAR1 = 2012
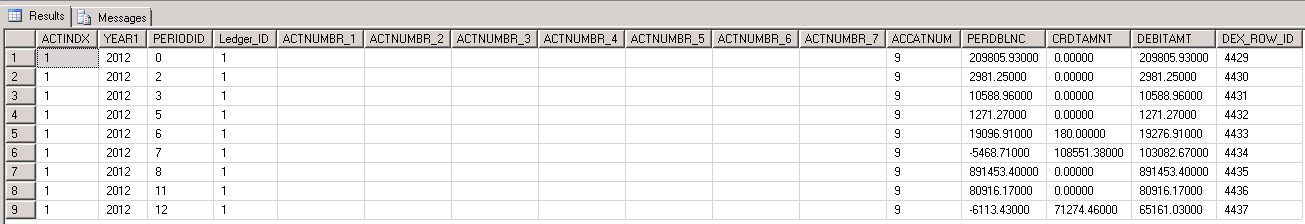
ASKER
Or, is it possible to simply add a "CASE WHEN" clause to the CTE code that says "if Opening Balance = 0 then display the Ending Balance from the previous row (i.e. where PREV.PERIODID < GL10111.PERIODID)"?
And, can another "CASE WHEN" clause be added saying "if Ending Balance = 0 then display that row's Opening Balance (from the previous CASE WHEN clause)"?
John
And, can another "CASE WHEN" clause be added saying "if Ending Balance = 0 then display that row's Opening Balance (from the previous CASE WHEN clause)"?
John
images of data do not assist, have I ever replied with an image of a query?
sample data is per table
there are 3 tables in your query
ideally sample data is in the form of inserts but as long as it can be parsed reliably it ca be as simple as this
table_name_here
column_names_here, next_column_name
value, value
Then, that sample data should relate to an expected result. Why? So we don't have to exchange many comments back and forth discussing what it is you really expected. Due to that you get your answer sooner.
So. for just one account in one or 2 years, provide DATA (per table & not as images) for each of the 3 tables, ensure that data demonstrates some missing months. Prepare (perhaps in excel, or from some report that you are attempting to match) what you EXPECT as a result - this may involve manual effort.
or, I could attempt another query variant and hope that it matches your expectations only to find it doesn't and we keep doing that trial and error cycle (at least one day per cycle) until a conclusion is found.
John perhaps I should say this. We "experts" are volunteers, not employees. Personally at the moment I get a few minutes each morning over breakfast to review yesterday's responses/queries. I may get a few minutes more during that day and might be able to snatch a little bit more in an evening depending on other things happening in a busy family home.
Every time I generate data on your behalf I am taking a leap of faith that it is a realistic representation of your actual data and something that you will take the time to understand. I provide both data and results so that you can do that. I have done it more than once. At each time I have done this I have provided a GUESS. I no longer wish to do this because it does not appear to be working for you and certainly not for me. If you take some time to prepare both the sample/test data and the expected result - then (& only then) do I have a benchmark to hit. So far I feel like it has been a moving target.
You may feel I am being grumpy - and to some extent that is true - but the process of preparing the data and expected result is a process you should be familiar with - it is a discipline needed not only for questions but for testing as well.
do please read this: http://sscce.org/
ASKER
Thank you, Paul. You have been a big help, just the same. :)
John
John
are you giving up? when so close? pity
ASKER
You said that you could not and would not assist further. At least, that's how I interpreted what you said.
Was I wrong?
Was I wrong?
yes, you are wrong, I said I needed sample data and expected result...
and if you were to go back through this question it is something I have asked for a number of times
I have a reason for insisting on them (both the data and the expected result) and hopefully you will appreciate why when we reach a solution.
and if you were to go back through this question it is something I have asked for a number of times
I have a reason for insisting on them (both the data and the expected result) and hopefully you will appreciate why when we reach a solution.
ASKER
ASKER
Hi Paul:
Please disregard the previous attachment. That was, you might say, an "accident".
Anyway, I have eight attachments, here on this post. The six queries are sample data that you requested.
The last two attachments are Excel spreadsheets. The first shows what SQL is displaying, for your query where ACTINDX = 1 and YEAR1 = 2012.
The second shows the data expected. I have highlighted, in the second spreadsheet, the rows containing "missing" data for Opening Balance and Ending Balance.
For the "Insert GL10111" script, I have three years represented--2011, 2012, and 2013.
Thanks, so much, for sticking with me, Paul! I really appreciate it!
John
CREATE-GL00100.sql
INSERT-GL00100.sql
CREATE-GL00105.sql
INSERT-GL00105.sql
CREATE-GL10111.sql
INSERT-GL10111.sql
What-is-Being-Displayed.xlsx
Expected-Results.xlsx
ASKER CERTIFIED SOLUTION
membership
This solution is only available to members.
To access this solution, you must be a member of Experts Exchange.
ASKER
Hello:
Can someone please get back to me, as soon as possible, on this?
Thanks!
John
Can someone please get back to me, as soon as possible, on this?
Thanks!
John
ASKER
Hi There:
Actually, thanks to someone named "RogerRogerATX" on the Microsoft Dynamics Community message board, I was able to get this figured out thanks to the following code that he and I worked on for SQL 2008:
WITH allbalances AS (
SELECT ISNULL(g.ACTINDX,p1.ACTIND
,p1.YEAR1
,p1.PERIODID
,ISNULL(g.DEBITAMT,0) AS debitamnt
,ISNULL(g.CRDTAMNT,0) AS crdtamnt
,ISNULL(g.PERDBLNC,0) AS netchange
,p1.PERIODDT
FROM (SELECT g.ACTINDX
,p.PERIODID
,p.YEAR1
,p.PERIODDT
FROM SY40100 p
CROSS JOIN GL00100 g
WHERE p.SERIES = 0
AND p.YEAR1 > 2010
) p1
LEFT OUTER JOIN GL10111 g ON p1.YEAR1 = g.YEAR1
AND p1.PERIODID = g.PERIODID
AND p1.ACTINDX = g.ACTINDX
)
select
g.ACTNUMST AS [Account Number]
,d.ACTDESCR as [Account Description]
,a.YEAR1 As Year
,a.PERIODID as Period
,b.NetChange - a.netchange as [Opening Balance]
,a.debitamnt AS [Debit]
,a.crdtamnt AS [Credit]
,a.netchange as [Net Change]
,b.NetChange as [Ending Balance]
FROM allbalances a
inner JOIN GL00105 g on a.ACTINDX = g.ACTINDX
inner JOIN GL00100 d on a.ACTINDX = d.ACTINDX
CROSS APPLY (SELECT SUM(netchange) AS NetChange
FROM allbalances b WHERE a.ACTINDX=b.ACTINDX AND b.PERIODDT <= a.PERIODDT
and a.YEAR1=b.YEAR1) b
ORDER BY g.ACTNUMST,a.YEAR1,a.PERIO
Thanks!
John
ASKER
I've requested that this question be closed as follows:
Accepted answer: 0 points for backinthe1980s's comment #a41621169
for the following reason:
This gave me the answer that I needed, after thorough testing.
I do want to thank everyone who chimed in to offer help, though! It was much appreciated!
John
Accepted answer: 0 points for backinthe1980s's comment #a41621169
for the following reason:
This gave me the answer that I needed, after thorough testing.
I do want to thank everyone who chimed in to offer help, though! It was much appreciated!
John
are you serious?
You took my code to another community, and want to close out this question, for you as the solver AFTER I have provided an exact match to the expected result.
Would you care to reconsider what you have done here?
& There is no attribution for the SQL you copied from here either....
Would you care to reconsider what you have done here?
& There is no attribution for the SQL you copied from here either....
ASKER
Hello:
I'd like to cancel my request showing me as the solver and show that Paul Maxwell was the solver.
Incidentally, I just went on the other community and posted that any initial code that I asked about in that community's posting was created by Paul Maxwell.
I apologize, for any confusion or concerns that I caused.
Thanks, All. And, thank you, Paul!
John
ASKER
By the way, I did not see that Paul had posted updated code, after I had provided sample data. Honestly, I missed that. I was concluding my work day. Either (a) I had posted that code from another community at the same time that Paul was composing his answer to me or (b) I was in a hurry to get my work concluded for the weekend and missed Paul's response.
Again, I apologize to everyone and to Paul!
Thank you!
John
Again, I apologize to everyone and to Paul!
Thank you!
John