happy 1001
asked on
Excel Charts for Dynamic Date Range
Hi Experts
I have an excel sheet in which I have the data for a few stocks and I need to create the Line Charts for them. But the Line Charts needs to be made in such a manner, that the “Number of Days to be plotted” do not need to be fixed beforehand. If I have 5 days data some day, then it should plot that 5 days data and if I have 20 days data on some other day, then it should automatically be able to plot those 20 days data, without any manual modifications from my side.
I have explained the requirement in very clear and detailed manner in the attached sample file.
Please suggest various methods by which this could be done.
If you have any doubts, then please ask them, and I would explain in more details.
I am using the following software versions -
Microsoft SQL Server Management Studio version- 12.0.2000.8,
Microsoft Office 2016 x64
and Windows 7 x64
I have attached the Excel File having the data and the sample charts.
Excel-Chart-for-different-durations.xlsx
Thanks
ASKER
@Rgonzo1971, thank you so much for your suggestion. But unfortunately I will not be able to use the methods of TABLES in my case, because I have uploaded the most simple sample for illustration purpose. The real data is very big and has data for hundreds of symbols and I need to keep empty columns between every two symbols, because I would be using those columns for some calculation type of work.
So if possible, please suggest some alternative methods in which I do not need to convert the data into table, and yet I will be able to plot all the data on the line chart, on different days, having data for different number of days.
Thanks and regards
So if possible, please suggest some alternative methods in which I do not need to convert the data into table, and yet I will be able to plot all the data on the line chart, on different days, having data for different number of days.
Thanks and regards
ASKER CERTIFIED SOLUTION
membership
This solution is only available to members.
To access this solution, you must be a member of Experts Exchange.
ASKER
@psteff, thanks a lot for interesting suggestion. I tried to implement it. First I created both the named ranges as told by you -
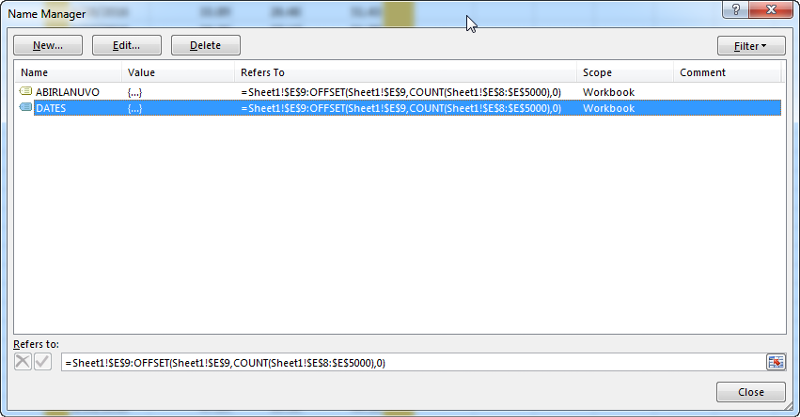
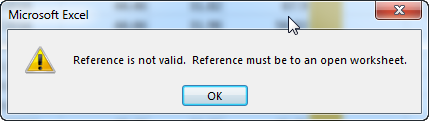
And then tried to create a chart and tried to add the named ranges into their proper place, as suggested by you. But it keeps on showing this error -
I am using the exact file, that I have uploaded in the first post, with exact same file name.
I tried to use different naming methods like -
='Excel-Chart-for-differen
='Excel_Chart_for_differen
='Excel Chart for differentdurations.xlsx'!D
But all of them is showing me the same error message.
Can you please suggest, what might be causing the problem here.
Thanks a lot for the help.

And then tried to create a chart and tried to add the named ranges into their proper place, as suggested by you. But it keeps on showing this error -
Reference is not valid. Reference must be to an open workbook.
I am using the exact file, that I have uploaded in the first post, with exact same file name.
I tried to use different naming methods like -
='Excel-Chart-for-differen
='Excel_Chart_for_differen
='Excel Chart for differentdurations.xlsx'!D
But all of them is showing me the same error message.
Can you please suggest, what might be causing the problem here.
Thanks a lot for the help.
Strange – how Excel seems to be working.
I originally had it working in my copy, but when I went to try it now – you are right, it did not work putting just that information in. So, I tried it a different way. I put in the following, respectively:
='SHEET1'! ABIRLANUVO
='SHEET1'!DATES
It then worked – but when I looked back in those areas, it replaced the ‘sheet1’ with the workbook name. Why Excel is acting this way in this area is a total mystery to me – but it appears that you have to put the sheet reference in when initially entering in the information.
I hope it now works for you.
ASKER
@psteff, thank you for providing the additional information. The new method works fine.
Thanks a lot
Thanks a lot
You are welcome. Glad to be of help!
pls try with a table
Regards
xcel-Chart-for-different-durationsV.xlsx