Dialogbox API leak?
Hi dear Experts:
I got memory leak error from Microsoft Visual studio 2015 diagnostic tools,
I am calling function:
DialogBoxParam(hInst, MAKEINTRESOURCE(IDD_ABOUTB
For each time I call this API, I got leak if I set break point just before after this call, the diagnostic tools window shows the memory keep increasing.
I just wonder if this is a real leak or just a false alarm from the tool?
I found that if I set the parent window handle to be not a null, then there is no leak at this time.
I have attached the picture.
And I also attached the source code zip file.
Thanks for any help.
DialogboxAPILeak.png
TestWin32Dialog.cpp
TestWin32Dialog.h
TestWin32Dialog.rc
Resource.h
ASKER
This is the first time that I hear that I need to free the buffer for dialogbox API, I did not allocate memory for this API, I do not have an handle or pointer to free the buffer, it is all handled by Windows. Please tell me further, if there is any way we can do it? Thanks.
ASKER
Hi Sara, here are your answer in the over question thread:
but there is no resource load or memory allocation here
and what is about:
1:wcex.hIconSm = LoadIcon(wcex.hInstance, MAKEINTRESOURCE(IDI_SMALL)
Select all
Open in new window
where did you free this resource?
can you show a picture of the dialog or post the rc file?
note, a visual c++ program uses a framework via stdafx.h. even if you use c code for dialog processing you still catch some automatic instantiations from framework. in the debugger things go worse since the debugger needs to make extra allocations for each variable you used. so if you detect leaks while running the program in debug mode but can't detect leaks in release mode, all your efforts are wasted.
Sara
ASKER
I have attached the rc files and cpp files here,
Most code is generated from VS wizard, what I have changed is the about dialog box. Just open and close the about dialogbox, is not leak, if I changed the parent window to be null, then it is leaking.
Just use VS diagnostic tools for DialogboxParam, one statement.
The statement you said:
wcex.hIconSm = LoadIcon(wcex.hInstance, MAKEINTRESOURCE(IDI_SMALL)
Is not in any about box call back function. So it does not matter. If this leak, it does it for the whole program, it will not contribute to dialogbox leak.
ASKER
OK, I have attached the picture of the program. It is a App Wizard generated program, I just changed the window handle for dialog box, and used VS diagnostic tool for only one statement, it gets consistent leak.
MemoryLeakTest.png
MemoryLeakTest.png
Hi Evan Li,
IMO you should try to find out if there's probably just a problem in the displayed diagnostic info. To verify the memory leaks you can try dumping them using _CrtMemCheckpoint and _CrtMemDumpAllObjectsSince
ZOPPO
IMO you should try to find out if there's probably just a problem in the displayed diagnostic info. To verify the memory leaks you can try dumping them using _CrtMemCheckpoint and _CrtMemDumpAllObjectsSince
bool CallDialog(HWND hWnd)
{
	_CrtMemState state = {};
	_CrtMemCheckpoint(&state);

	INT_PTR nResponse = DialogBoxParam(hInst, MAKEINTRESOURCE(IDD_ABOUTBOX), NULL, About, 0);

	_CrtMemDumpAllObjectsSince(&state);
	return true;
}ZOPPO
you may try to create an mfc app dialog-based. you may use the app wizeard to copy the dialog resource from your current project to the mfc project. i wonder what the leak diagnostic would tell with this approach.
Sara
Sara
ASKER
Hi, Zoppo:
I used Visual leak detector and CRT memory check APIs. both does not show memory leaks,
I did my test again, Here is what I have got:
Dumping objects ->
Object dump complete.
Dumping objects ->
Object dump complete.
Dumping objects ->
Object dump complete.
Dumping objects ->
Object dump complete.
But in diagnostic tools, it indicated that the memory keep getting up.
ASKER
MFC code:
CAboutDlg aboutDlg;
aboutDlg.DoModal();
does not have a leak from diagnostic tools.
CAboutDlg aboutDlg;
aboutDlg.DoModal();
does not have a leak from diagnostic tools.
as told when creating the window you were loading some resources which in my opinion were not freed by your code.
about dialog only should be tested after you opened it at least once (in your menu). mfc Dialogs load their resources in OnInitDialog which was virtually called as a response to WM_INIT_DIALOG message. since you have the mfc code you could debug what happens when a dialog was created and when it finally was destroyed. note, the creation and the destroying is a two-step action. the final freeing happens in OnDestroy and OnNcDestroy.
Sara
ok, that's really strange, I can reproduce it too now.
@Sara: to reproduce it you can simply create a Win32 (none-MFC) app from the scratch, it looks very similar to the code attached above. When debugging this app no memory leaks are shown when taking snapshots before and after showing the About-dialog.
BUT: As soon as you use NULL instead of hwnd in the call to DialogBox in WndProc the behavior changes and the diagnostic tool shows memory leaks between snapshots taken before and after showing the About-dialog:
 Here's a bit more info about the leak between the last two snapshots:
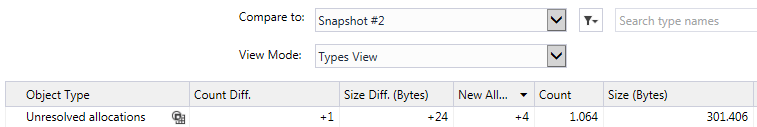 I have no idea why passing NULL as parent window leads to this problem, but I fear there's not a lot you can do against because it happens quite deep within Windows API calls (I attached a screenshot of the call-stack because unfortunateley the diagnostic tool's view doesn't have a function to copy/export the stack as text).
@Evan Li: IMO you only have two possibilities:
1. Change the code to use hwnd instead of NULL again. (BTW: why do you want to use NULL here at all?)
2. Live with the memory leak. It's only 24 bytes each time the dialog is opened, so it's extremely unlikely this will ever lead to a problem.
Best regards,
ZOPPO
memleakstack.png
@Sara: to reproduce it you can simply create a Win32 (none-MFC) app from the scratch, it looks very similar to the code attached above. When debugging this app no memory leaks are shown when taking snapshots before and after showing the About-dialog.
BUT: As soon as you use NULL instead of hwnd in the call to DialogBox in WndProc the behavior changes and the diagnostic tool shows memory leaks between snapshots taken before and after showing the About-dialog:
Here's a bit more info about the leak between the last two snapshots:I have no idea why passing NULL as parent window leads to this problem, but I fear there's not a lot you can do against because it happens quite deep within Windows API calls (I attached a screenshot of the call-stack because unfortunateley the diagnostic tool's view doesn't have a function to copy/export the stack as text).@Evan Li: IMO you only have two possibilities:
1. Change the code to use hwnd instead of NULL again. (BTW: why do you want to use NULL here at all?)
2. Live with the memory leak. It's only 24 bytes each time the dialog is opened, so it's extremely unlikely this will ever lead to a problem.
Best regards,
ZOPPO
memleakstack.png
ASKER
Thank you Zoppo,
Here is my Question,
1>I have MS Diagnostic tool, which can report me the memory leak
2>I have Visual Leak Detector
3>I have CRT checkMemory APIs just as you suggested.
they do not produce the consistent result. Which tool I should trust?
Here you saw the situation that Visual Studio Diagnostic tools reported error, but CRT memory check API says no memory leak, I have situation that Diagnostic tool told me there is not leak but CRT memory check shows errors.
Which one to trust, In both situation, I could not find the root cause.
Thank you for your help again.
can we call 24 bytes not freed a leak? i would say only if the next calls again would allocate the same amount. you should see that a static instantiation of a 24 byte structure - for example to serve as a pseudo parent window - might be responsible for the growing.
Sara
Sara
ASKER CERTIFIED SOLUTION
membership
This solution is only available to members.
To access this solution, you must be a member of Experts Exchange.
ASKER
Thank you both Zoppo and Sara.
This should be an API bug. But we need to work around it.
Thank you again.
This should be an API bug. But we need to work around it.
Thank you again.
ASKER
Hi Zoppo,
I have a question in another thread that is related to this one. From time to time, I got leak, says "unresolved allocation" in Visual studio, I could not find where my code is wrong if you look at call stack. How are you going to do this in this situation?
I have a question in another thread that is related to this one. From time to time, I got leak, says "unresolved allocation" in Visual studio, I could not find where my code is wrong if you look at call stack. How are you going to do this in this situation?
ASKER
yes, you should close it as the last comment pointed to this thread.
Sara
Sara
Sara