DGWhittaker
asked on
Aceess 2016 - Variable Data Fields?
Greetings!
I am looking to find out if it is possible to have fields with variable data types based on data.
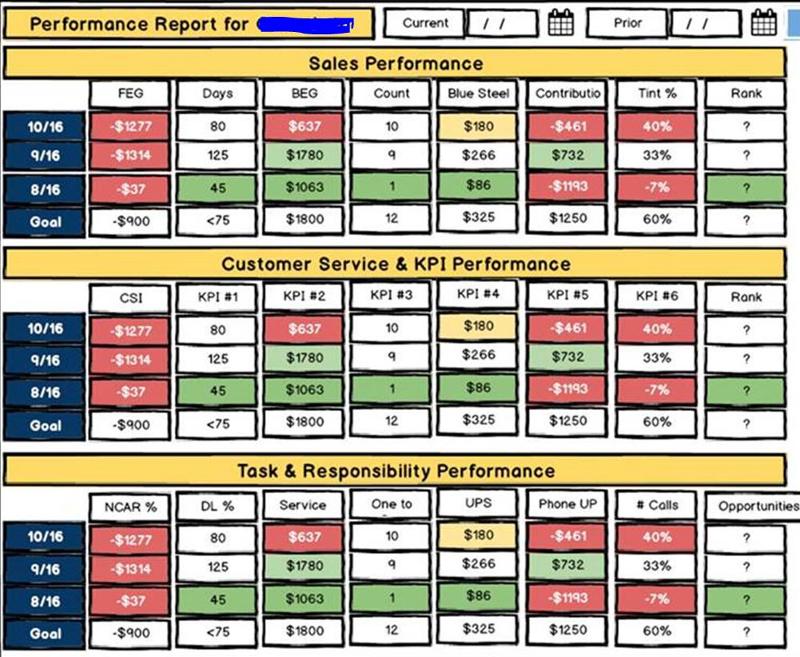
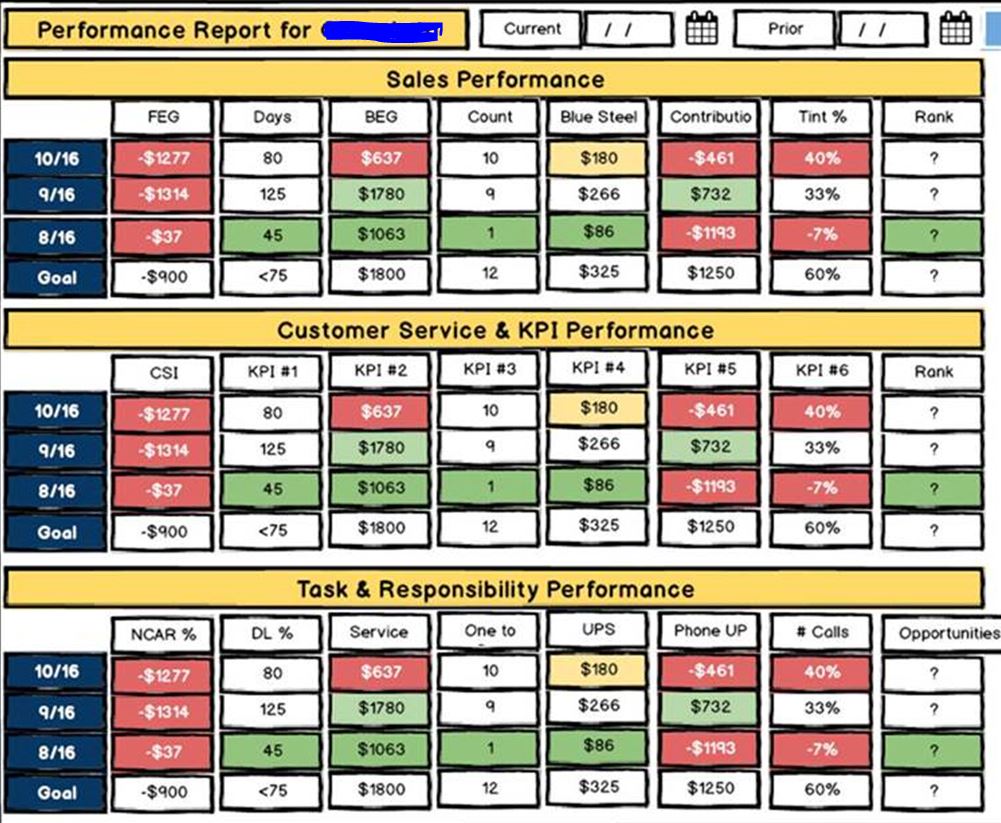
My goal is to allow each of our 6 business units to define the titles for each metric in this report as well as how the data will appear (currency, percent, etc)
I picture a field asking for the data type, which would drive the formatting of the output on the forms and reports.
So the data itself doesn't really need to be managed, so much as the way it appears.
Thanks for your thoughts and insights!
I am looking to find out if it is possible to have fields with variable data types based on data.
My goal is to allow each of our 6 business units to define the titles for each metric in this report as well as how the data will appear (currency, percent, etc)
I picture a field asking for the data type, which would drive the formatting of the output on the forms and reports.
So the data itself doesn't really need to be managed, so much as the way it appears.
Thanks for your thoughts and insights!
Excel appears to be the better tool for this.
/gustav
/gustav
<<My goal is to allow each of our 6 business units to define the titles for each metric in this report as well as how the data will appear (currency, percent, etc)>>
What you want to do is possible by using a Entity Attribute Value design (EAV for short).
But I'm not sure it's really needed here. Adding onto Scott's comments, it appears to me that it's more one of a ad-hoc report generation; taking existing data and allowing the use what and how they want to see it. If you want them to be able to define the data that is being stored, then that's a different thing entirely and in short, you'd be talking about creating something like Access<g>
I think it would be good to step back first and have you layout how you envision this working from start to finish so we have a clear understanding of this.
Jim.
ASKER CERTIFIED SOLUTION
membership
This solution is only available to members.
To access this solution, you must be a member of Experts Exchange.
SOLUTION
membership
This solution is only available to members.
To access this solution, you must be a member of Experts Exchange.
ASKER
Thanks All!
I am reading through everyone's comments and suggestions.
Dale, Thank you so much for putting your idea into an access file that I can learn from.
As I work through this to decide how to score it, here is a general question tied to the "Access vs Excell" challenge brought up here.
My goal is to create this system ( this reporting function is a component within) such that the daily maintenance is both minimal and affordable (re: an admin can upload any of the required data without supervision and maintain data integrity)
While I do find a number of things easier to manage in excel, it seems like it would be more manageable long term if it all came in as raw data into access.
I am pulling data from at least 5 different systems, multiple data streams within them, in order to bring a true view of all the moving pieces in a car dealership.
I look forward to your insights.
Thanks !
Dennis
SOLUTION
membership
This solution is only available to members.
To access this solution, you must be a member of Experts Exchange.
SOLUTION
membership
This solution is only available to members.
To access this solution, you must be a member of Experts Exchange.
Scott. I haven't worked with CR in years. We gave it up because it was less user friendly than Access reporting but I don't think it will work well with an Excel spreadsheet type table where each row has different definitions of column contents and data types.
DG, You haven't said where your data is coming from. If each of these separate pieces is imported from a different source, I would put them in different tables since they actually contain different data in each row. Then make subreports and bring them all together for presentation in a main report.
This is a "no code required" situation since each table contains consistent data. You just create a report and group or sum as necessary since the definitions for all rows in the set are the same.
Thee is no advantage to mushing unlike data into a single table. I once had a manager back in my mainframe days who when I presented him with a project plan that outlined 14 programs asked me how long it would take my team if we did 7 programs. I'll leave it to you to come up with an answer to that question that wouldn't get you fired. I ended up buying him a book on programming that explained coupling and cohesion and he got the message.
ASKER
Thanks All!
Dennis
Dennis
Pat: I work with CR quite often, and you could certainly create "dashboard" like reports with it from disparate data sources - in fact, that's kinda one of the strong points of CR! It is not as user-friendly as Access (as I mentioned in my post), but it is far more powerful than the Access reporting engine. I've seen some amazing things created with CR (not by me). You should not discount CR simply because the Access reporting interface is easier to learn.
ASKER
Thanks All!
Dennis
Dennis
https://msdn.microsoft.com/en-us/library/office/gg251755.aspx
So you could store the format requirements in a table, and use that table to construct an SQL statement with the necessary Format layouts applied at runtime.
That said, it would be difficult to show the same data in different ways. In your example, the "Days" column shows data in what appears to be standard Numeric format, as well as a Percentage format. Numeric format is straight forward - you just display the data as-is - but a Percentage is some sort of calculation, not just the data. In other words, you're showing a value of "80" in the first row, which is fine for numeric, but if you show it in a Percentage format, what is "80" a percentage of?