jqplot Pie Chart - javascript
Hi All,
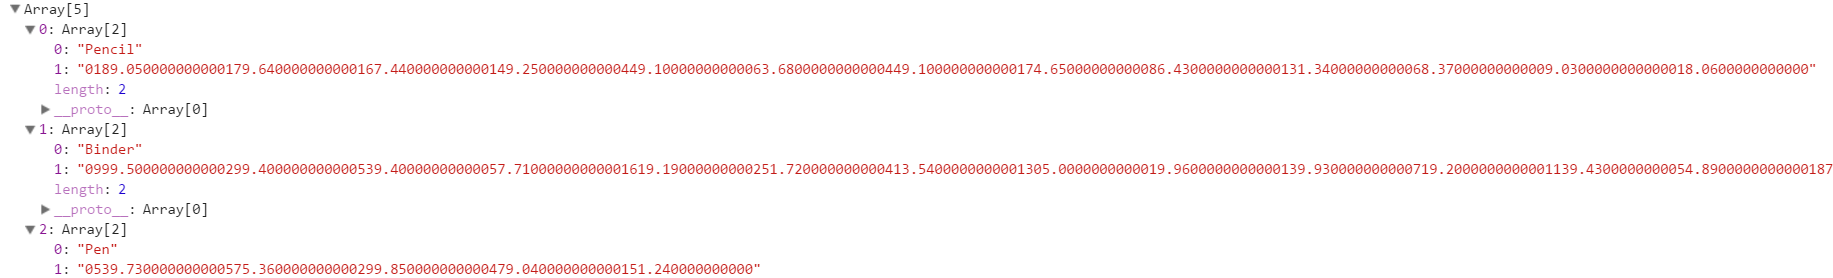
I am trying to create a jqplot pie chart. The code below does not produce any errors but it's also not calculating correctly. It's supposed to add numbers but it concatenates instead. See line 44.
Here's what I see in the developer tool..
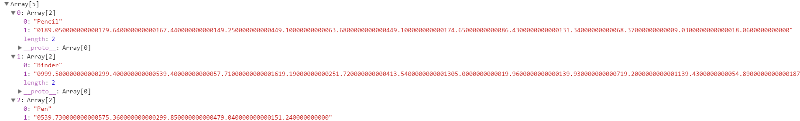
I am trying to create a jqplot pie chart. The code below does not produce any errors but it's also not calculating correctly. It's supposed to add numbers but it concatenates instead. See line 44.
// JavaScript source code
//Create name space so their will be no collisions if application grows
var schoolApp = window.schoolApp || {};
schoolApp.itemType = new Array();

$(document).ready(function () {
    SP.SOD.executeOrDelayUntilScriptLoaded(retrieveData, "sp.js");
});

function retrieveData() {
    var allItems = new getItems();

    $().SPServices({
        operation: "GetListItems",
        async: false,
        listName: "SchoolITems",
        CAMLViewFields: "<ViewFields>" +
                              "<FieldRef Name='Item' />" +
                              "<FieldRef Name='orderDate' />" +
                              "<FieldRef Name='Region' />" +
                              "<FieldRef Name='Title' />" +
                              "<FieldRef Name='Total' />" +
                           "</ViewFields>",
        completefunc: function (xData, Status) {
            $(xData.responseXML).SPFilterNode("z:row").each(function () {
                allItems.addItems($(this).attr("ows_Item"), $(this).attr("ows_Total"));
            });
        }
    });

    chartArray = allItems.getChartData();
    plotChart(chartArray);
}

function getItems() {
    this.inputs = {};
    this.items = [];

    this.addItems = function (unqItem, amount1) {
        if (!this.inputs[unqItem]) {
            this.items.push(unqItem);
            this.inputs[unqItem] = 0;
        }
        this.inputs[unqItem] += amount1;
//        this.inputs[unqItem] = this.inputs[unqItem] + amount1;


    };

    this.getChartData = function () {
        var chartAry = [];
        for (i = 0; i < this.items.length; ++i) {
            chartAry.push([this.items[i], this.inputs[this.items[i]]]);
        }
        return chartAry;
    }

} // end of function truck2pie


function plotChart(data) {
console.log(data);
    var plot1 = jQuery.jqplot('pieChart', [data],
    {
        seriesDefaults: {
            // Make this a pie chart.
            renderer: jQuery.jqplot.PieRenderer,
            rendererOptions: {
                fill: true,
                sliceMargin: 7,
                dataLabels: 'value',  //Show data instead of label
                showDataLabels: true,
                linewidth: 5,
                shadowOffset: 2,
                shadowDepth: 5, //Number of strokes to make when drawing shadow. Each stroke offset by shadowOfset from the last.
                shadowAlpha: 0.07
            }
        },
        legend: { show: true, location: 'e' }
    }
  );

}Here's what I see in the developer tool..
ASKER CERTIFIED SOLUTION
membership
This solution is only available to members.
To access this solution, you must be a member of Experts Exchange.
ASKER