Sean Garrison
asked on
Help with identifying flows in Viso Excel Reports
Hi,
I have created a custom stencil in Visio to capture specific data for a process flow that I can export to Excel. Now that I have mapped out the process, I have started to manipulate the data in Excel. The process, however, has several flows and I need to determine which steps follow each other and are part of the same flow. In Visio this is easy because you can visually see the process, but in Excel everything is listed as a row and it's unclear.
Is there a way to add shape data that will determine the sequencing of the shapes once they are in exported in Excel? Perhaps using the Dynamic Connectors to link the shapes to each other?
Thanks,
Sean
ASKER
Hi Scott, thanks for your example. It appears that process has 2 flows (sad customer and happy customer). How would you use the To and From fields to count these flows? It appears that the Decision shape is an indicator of additional flows, so I wonder if we could use the Decision shape to identify the associated steps within a flow.
To give you some background, my processes have a total volume which I want to recalculate for each flow. I have customized the Decision shape to capture the % of when the user follows the "Yes" flow and the "No" flow. I am looking to incorporate the logic of a Mississippi Diagram to recalculate the volume for each flow. These processes can have several Decisions which can result in 10+ flows that often overlap at some point. My thought is that if I can export the individual flows in Excel so that they are grouped by the steps within them, I can then calculate the volume for each flow (which will sum to the total process volume).
Please let me know if you need additional clarity or if an example diagram would help explain my scenario.
Thanks again for your help!
Sean
Thanks for the additional explanation. I didn't understand correctly the first time around what you were trying to do.
The good news, I think, is that the code could be modified to do what you want. While the goal for the current code is to record the 'from' and 'to' shapes at the ends of the connectors, we could modify it to do the calculations you're interested in. Essentially, the code works now by "walking" the paths in the diagram to figure out what it attached to what; we could enhance the logic to recognize decision shapes and compile calculations along various paths. Not trivial necessarily, but certainly doable. I'm not sure yet how we'd capture the output... store intermediate results in each shape? Create a special shape to store paths and their associated total? Which could then be exported to Excel? Ideally, I suppose, it would make sense to write output directly to Excel.
Let me know your thoughts. And, yes, a sample diagram would help in understanding the diagram and data.
Hi Scott
What version of Visio did you write this macro for? (I currently have Visio 2010 Standard)
For I've downloaded your example, ran the macro and created a report using "Shape Reports".
But the fields "From" and "To" remain empty.
Going into debugger mode, it looks like a lot of errors are generated (cf. attachment). But I'm a total novice to all this, so this may be normal.
Capture.PNG
The diagram containing the macro is a Visio 2010 vsd file -- it should open and run correctly in just about any version of Visio.
Here's the before and after when I run the macro. With any dynamic connector selected (the 'Yes' path in this case), there are no shape data fields when you open the diagram: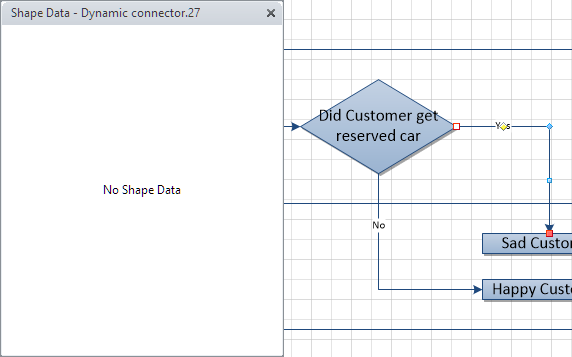 But after running the macro there are two shape data fields that contain the description text from the shapes on either end:
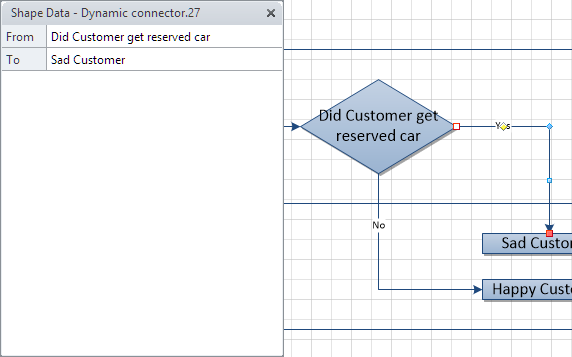 At this point you Visio report should show the values from the From/To fields.
Here's the before and after when I run the macro. With any dynamic connector selected (the 'Yes' path in this case), there are no shape data fields when you open the diagram:
But after running the macro there are two shape data fields that contain the description text from the shapes on either end: At this point you Visio report should show the values from the From/To fields.
Thx for the clarification. I hadn't checked the Shape Properties. Having done that now, I can confirm that the macro works fine indeed.
The problem was with the exporting: I had used Shape Reports, but this only exports the shapes, not the connectors.
I've resolved the problem with using the database export wizard.
Thx again,
Patrick
The problem was with the exporting: I had used Shape Reports, but this only exports the shapes, not the connectors.
I've resolved the problem with using the database export wizard.
Thx again,
Patrick
I'm glad you found a way to extract the data you need.
BTW, you should be able to use the report writer to extract the required data. It will report on connectors as you can see here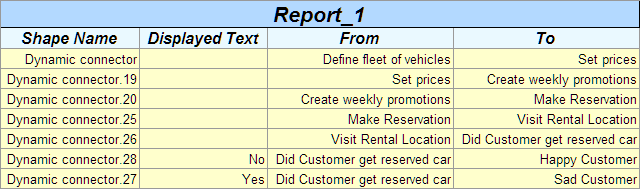
BTW, you should be able to use the report writer to extract the required data. It will report on connectors as you can see here
Sean -- If my answers were helpful, please click the Best Solution button on one of them to close the questions. Thanks.
This question needs an answer!
Become an EE member today
7 DAY FREE TRIALMembers can start a 7-Day Free trial then enjoy unlimited access to the platform.
View membership options
or
Learn why we charge membership fees
We get it - no one likes a content blocker. Take one extra minute and find out why we block content.
If this is close but you need to tweak it a bit, just let me know as it's easy to modify the code.
Determine-flowchart-paths-PROP.vsd