Javascript Debugging
For some reason (must be me), I am having lots of trouble setting breakpoints in my JavaScript. I have tried with Chrome, FireFox (Dev edition and regular) and IE and when I can find the line to break, it doesn't break on it when I refresh.
I am using dreamweaver (latest) and try to preview in each browser and then hit f12 to open the tools, but no breaks for me.
Please advise. This is bizarre.
I am using dreamweaver (latest) and try to preview in each browser and then hit f12 to open the tools, but no breaks for me.
Please advise. This is bizarre.
ASKER
Here is the code:
From Dreamweaver I preview it and try with f12 to get to break in the script. I search for a function in the page, set the break and it doesn't break. The ready message is displayed as are the alerts on the returns, but no luck on breaking.
<!DOCTYPE html>
<html>

  <head>
    <script src="https://ajax.googleapis.com/ajax/libs/jquery/3.1.1/jquery.min.js" data-require="jquery@*" data-semver="3.1.1"></script>
    <link href="style.css" rel="stylesheet" />
    <script src="script.js"></script>

    <script type="text/javascript">
    $( document ).ready(function() {

        alert( "ready!" );

		var p = ["NPD-2016-12", "XYZ", "   ", "XYZ", " "];
		var c = CleanedArray(p);

		var cc = DedupeArray (c);

		alert (c + " : Length=" + c.length);
		alert (cc + " : Length=" + cc.length);

		$(".btnTest").click(function() {

			alert( "Handler for .click() called." );

		});

    });

    </script>

    <script type="text/javascript">

	  function CleanedArray(p) {
		  var cleanp = [];
		  for (var ptr=0; ptr<p.length; ptr++) {
			  var tmp = p[ptr];
			  tmp = tmp.trim();
			  if (tmp.length>0) {
				  cleanp.push(tmp);
			  }
		  }
		  return cleanp;
	  }

	function DedupeArray(aR) {
		try {
			var listlength = aR.length;
			var newaR =[];
			var currentVal = aR[0];
			var uniqueElement = true;
			newaR.push(currentVal);

			for (var ptrOuter=1; ptrOuter<listlength; ptrOuter++) {
				for (var ptrInner=2; ptrInner<listlength; ptrInner++) {
					if (aR[ptr]==currentVal) {
						uniqueElement = false;
					}
				}
				if (uniqueElement) {
					newaR.push(aR[ptrOuter]);
					uniqueElement = true;
				}
				currentVal = aR[ptrOuter];
			}
		}
		catch(err) {
			console.write('Error in DedupeArray:' + err.message);
		}
		finally {
			return newaR;
		}
	}


    </script>


  </head>

  <body>
    <h1>Hello Plunker!</h1>

    <button type="button" class="btnTest" style="background-color: blue; color: white">Test</button>

  </body>

</html>From Dreamweaver I preview it and try with f12 to get to break in the script. I search for a function in the page, set the break and it doesn't break. The ready message is displayed as are the alerts on the returns, but no luck on breaking.
ASKER
Also, note the breakpoint set in IE after Dreamweaver preview selected:

Sometimes I see an eval() with a line number and some disabled looking break icon.

Sometimes I see an eval() with a line number and some disabled looking break icon.
Are you talking about a breakpoint set in DW or in the F12 - where are you actually setting the break points?
I have no experience of DW - I set the break points in the browser using Dev Tools.
I have no experience of DW - I set the break points in the browser using Dev Tools.
ASKER
I am launching the browser via Dreamweaver.
Yes but where are you setting the breakpoint?
Have you tried going into F12 / Debugger and setting a break point there?
As I said not familiar with DW debugging.
Have you tried going into F12 / Debugger and setting a break point there?
As I said not familiar with DW debugging.
ASKER
It's outside of DW after I launch the browser. I use F12 to bring up the tools. What I have just found is that if I make local web site and save the file to the site, I can set breakpoints and they break. The issue is something with how DW wraps the page when it previews. That takes care of the DW part.
But, I still am finding in other pages, where the javascript is in a separate file that I cannot get to that file to attempt to set a break within. It's not clear if there may be some other issue like a component on the page that is wrapping the page somewhat like we observed with DW. I am wondering if it is a site setting (the pages for my dev work on in SharePoint) difference between my dev site and my prod site are to blame.
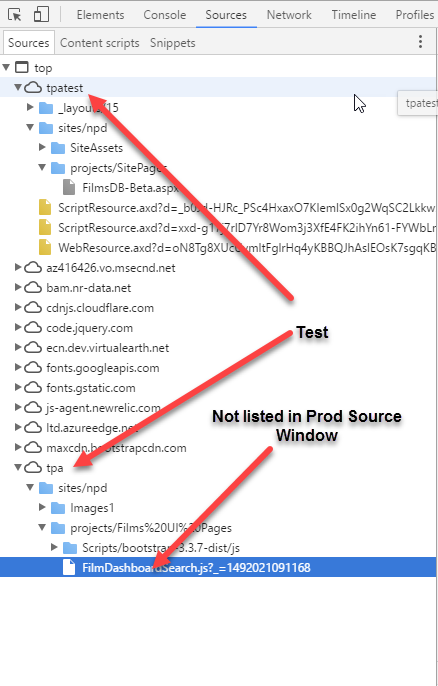
The tree of files when I hit F12 looks quite different even though the sites are structurally the same.
But, I still am finding in other pages, where the javascript is in a separate file that I cannot get to that file to attempt to set a break within. It's not clear if there may be some other issue like a component on the page that is wrapping the page somewhat like we observed with DW. I am wondering if it is a site setting (the pages for my dev work on in SharePoint) difference between my dev site and my prod site are to blame.
The tree of files when I hit F12 looks quite different even though the sites are structurally the same.
ASKER
Here is a view in chrome for source panels in test and prod sites:
Prod:

Test:
Prod:
Test:
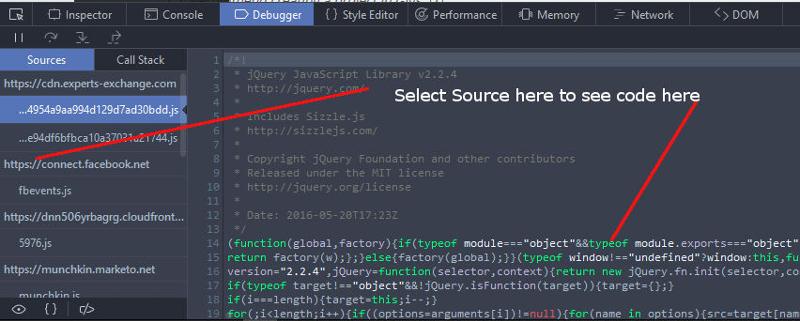
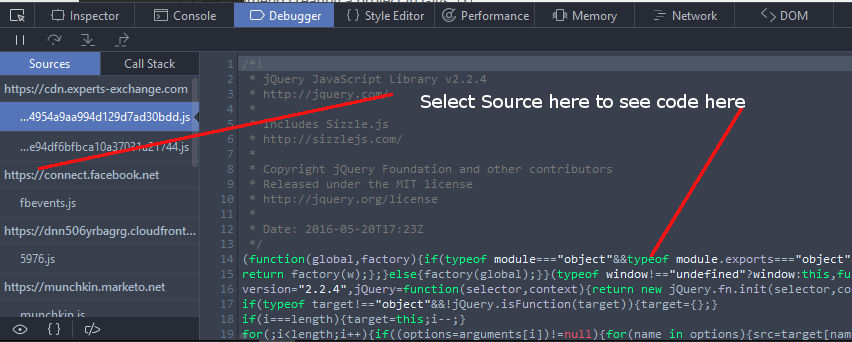
When you debug you have to select the script file that contains the code you are working in see below
ASKER
I see the file in test as depicted above but not in production. That's the quandary.
How do you publish your site - does DW do it for you. I am guessing there is some sort of minifying going on - your scripts and css are being compressed and packed - they usually come out the other side with a generated file name.
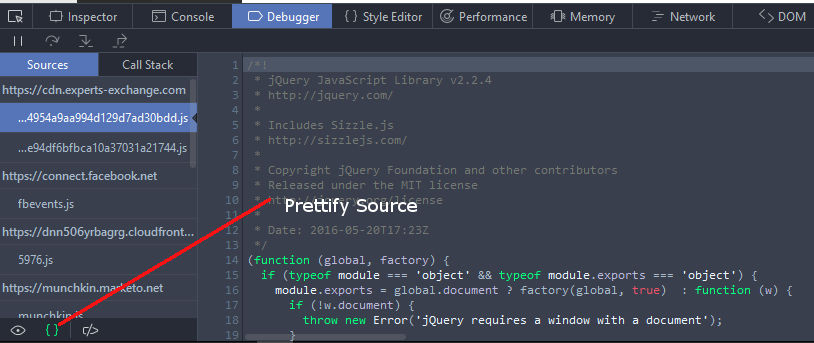
What you can do is go through each of the Sources by clicking on them and then examining the code. Because of the packing / compressing the code looks like a fruit salad - fortunately Dev Tools can help you out with the Prettify Source button see below
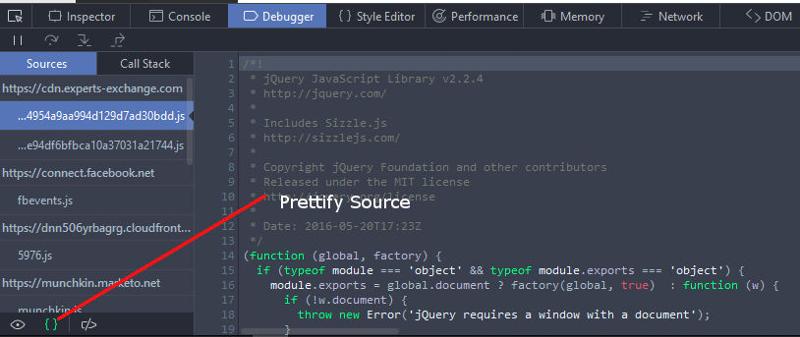
What you can do is go through each of the Sources by clicking on them and then examining the code. Because of the packing / compressing the code looks like a fruit salad - fortunately Dev Tools can help you out with the Prettify Source button see below
ASKER
No DW for SharePoint publishing. The process it pretty simple. You check out and download a file. You edit it, upload it, check it in an publish it. There is no minifying going on. I usually edit in notepad++, save locally and upload the file(s) check in and when needed publish them.
Then if you do a view source on the page you should see the script there. Click on the link and it should load - if that all works it should be visible in the list of scripts in the Debugger tab
ASKER
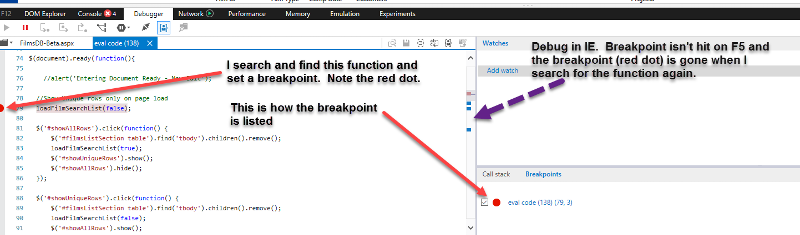
The script file reference is embedded and that may be why the debuggers don't show it. When I go to debugger and ask it to find a function to break in, the debugger finds it. But, the location listed in the breakpoints is odd: "eval code (138) (179,3)".
The (179,3) is the location in the js file that I set the breakpoint. I then hit the F5 key, the page reloads and the break not only isn't hit, but when I go back to the function, the breakpoint (the red dot) is gone.
The (179,3) is the location in the js file that I set the breakpoint. I then hit the F5 key, the page reloads and the break not only isn't hit, but when I go back to the function, the breakpoint (the red dot) is gone.
ASKER CERTIFIED SOLUTION
membership
This solution is only available to members.
To access this solution, you must be a member of Experts Exchange.
ASKER
I checked the URL you listed. It doesn't seem to apply. Here is a screen shot of the breakpoint in IE.
F5 doesn't then break there and when I find the function again the break isn't there.
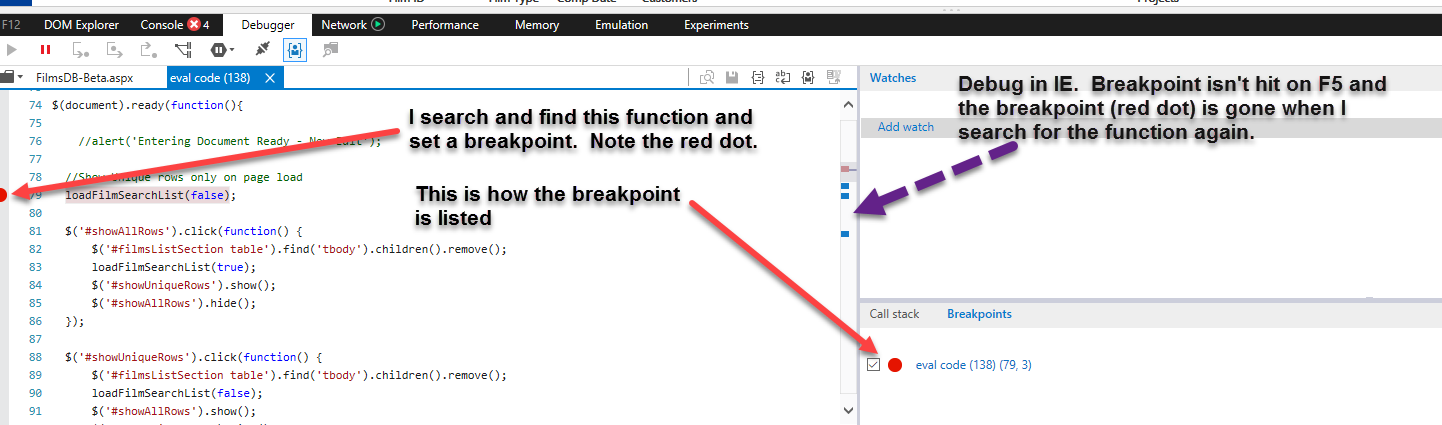
F5 doesn't then break there and when I find the function again the break isn't there.
Have you tried in FireFox? I don't have much experience with IE
ASKER
I have tried with IE, Chrome and Firefox (dev and non dev versions).
Can you find the file that code is in - i.e. view source and then click on the link to it.
ASKER
I know where the file is. I just don't see it in the debug list of folders and files.
@Howard,
Apologies for not replying.
Without being able to replicate difficult to diagnose. Suggest you wrap this question up and maybe ask again - this thread is long enough to become a TLDR for other experts.
Apologies for not replying.
Without being able to replicate difficult to diagnose. Suggest you wrap this question up and maybe ask again - this thread is long enough to become a TLDR for other experts.
I use breakpoints all the time without issue - in fact the only real issues are
a) Finding the line of code in the first place - not always obvious
b) Remembering to remove the break point