Change position of chart
Hi,
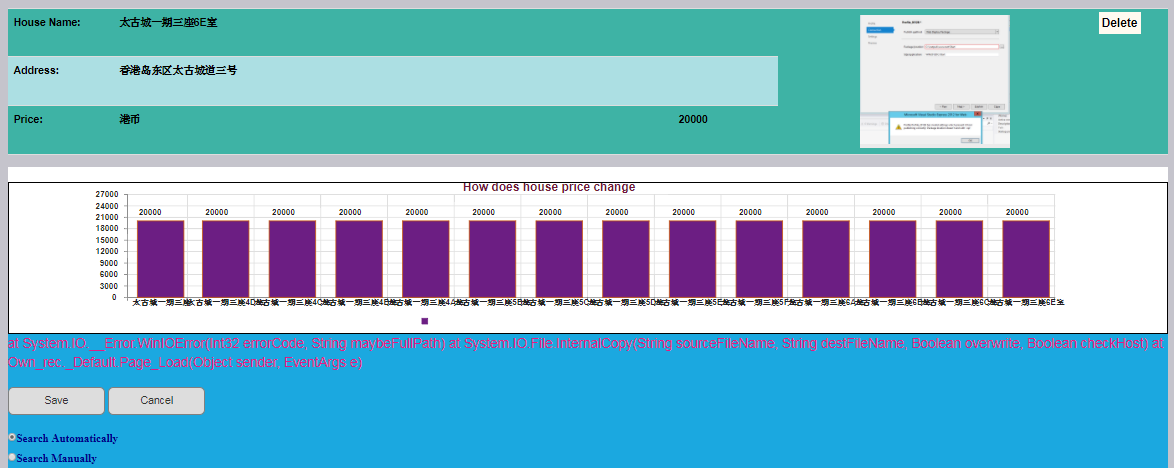
There is one chart shown to this
http://my-friend.co/Test_rec4/Default.aspx?userid=mc23
but how to change the position of chart to be a part of the House list?
There is one chart shown to this
http://my-friend.co/Test_rec4/Default.aspx?userid=mc23
but how to change the position of chart to be a part of the House list?
Kyle Abrahams, PMP
Move the div inside the table in another <tr> above the separator.
set chart width to 100%
what is your aspx code?
what is your aspx code?
@Abraham
he cannot do it, chart is aspx code (AjaxControlToolkit:BarCha
HMC, you can add this to your js file
and make chart width 100%, it will be like this

is this what you want?
he cannot do it, chart is aspx code (AjaxControlToolkit:BarCha
HMC, you can add this to your js file
$("#BarChart1").detach().appendTo($("#houses"));and make chart width 100%, it will be like this
is this what you want?
post your aspx code...
I guess you just need to move chart just after houses div, maybe inside another div...
try this style
and make chart width 100%, or * or auto or leave it empty...
we can try css or jquery later to adjust the width if we cannot set to 100% with aspx code...
I guess you just need to move chart just after houses div, maybe inside another div...
try this style
<div id=houses>...house data comes here dynamically</div>
<div id=housesChart>
  <AjaxToolkit:Barchart ....></AjaxToolkit:Barchart>
</div>and make chart width 100%, or * or auto or leave it empty...
we can try css or jquery later to adjust the width if we cannot set to 100% with aspx code...
Actually he could.
If he left off the
html += "<tr><td colspan=6 class='seperator'></td></t
Underneath the div he could just write another TR.
Then he could add his "<tr><td colspan=6 class='seperator'></td></t
and close off the table.
If he left off the
html += "<tr><td colspan=6 class='seperator'></td></t
Underneath the div he could just write another TR.
Then he could add his "<tr><td colspan=6 class='seperator'></td></t
and close off the table.
yes, but then again, we need to move AjaxControlToolkit:Barchar
which I indicated above...
chart is aspx server control, and that table is dynamic, filled on client side...
so, easiest way is just move the chart under the houses div which contains the house data...
like this
it is just cut and paste the aspx control one line above in aspx :)
moving chart is not a good idea on client side...
which I indicated above...
chart is aspx server control, and that table is dynamic, filled on client side...
so, easiest way is just move the chart under the houses div which contains the house data...
like this
<div id=houses>...house data comes here dynamically</div>
<div id=housesChart>
  <AjaxToolkit:Barchart ....></AjaxToolkit:Barchart>
</div>
<div>
  the blue area with buttons and options here...
</div>it is just cut and paste the aspx control one line above in aspx :)
moving chart is not a good idea on client side...
ASKER
Hi Hainkurt,
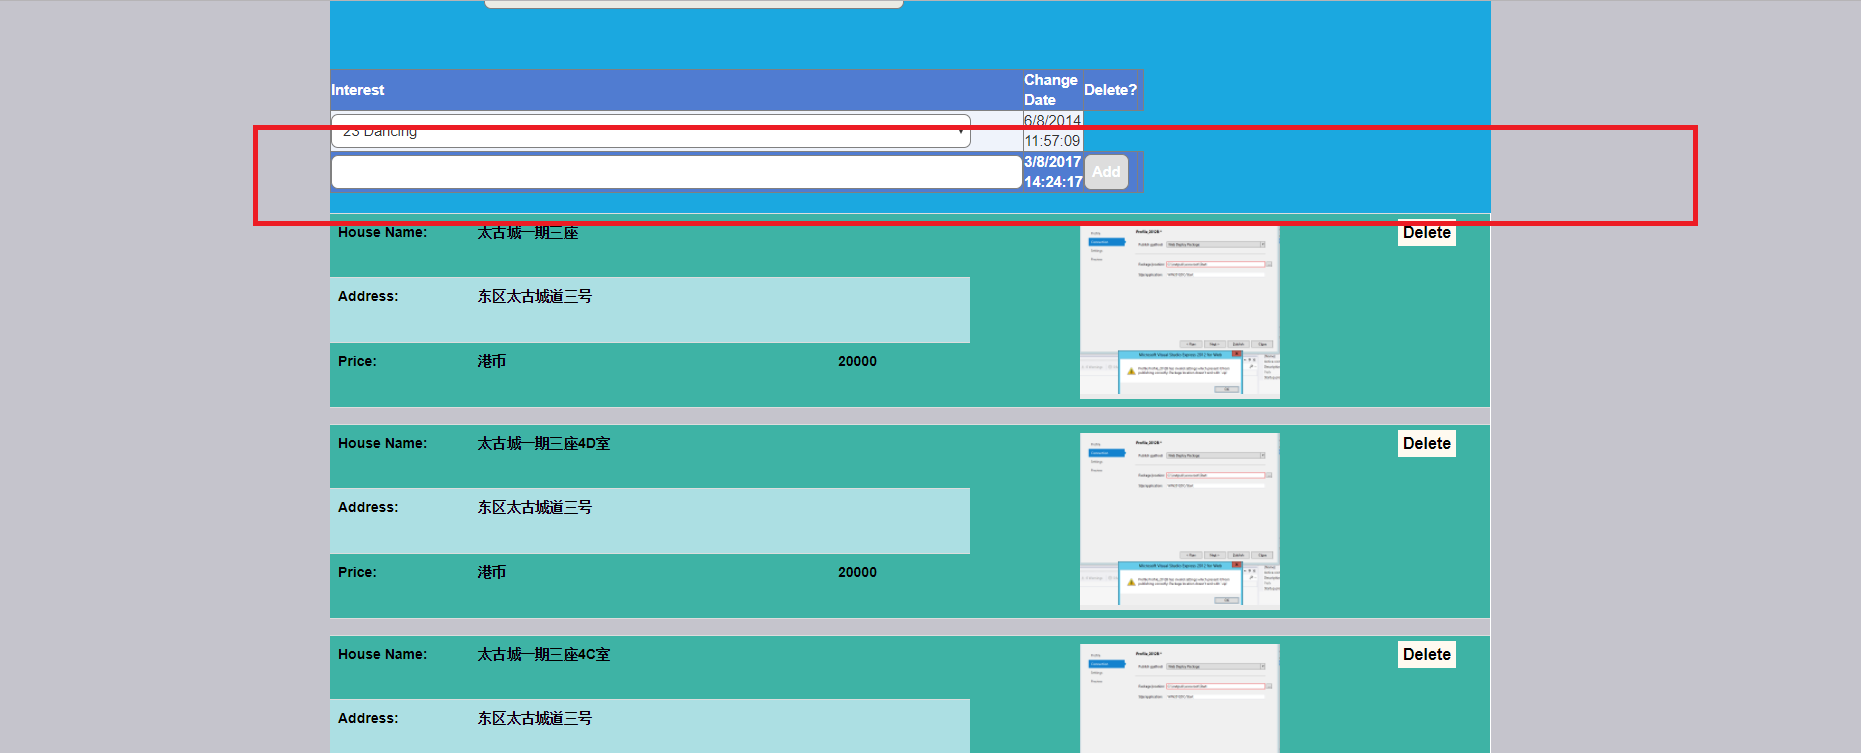
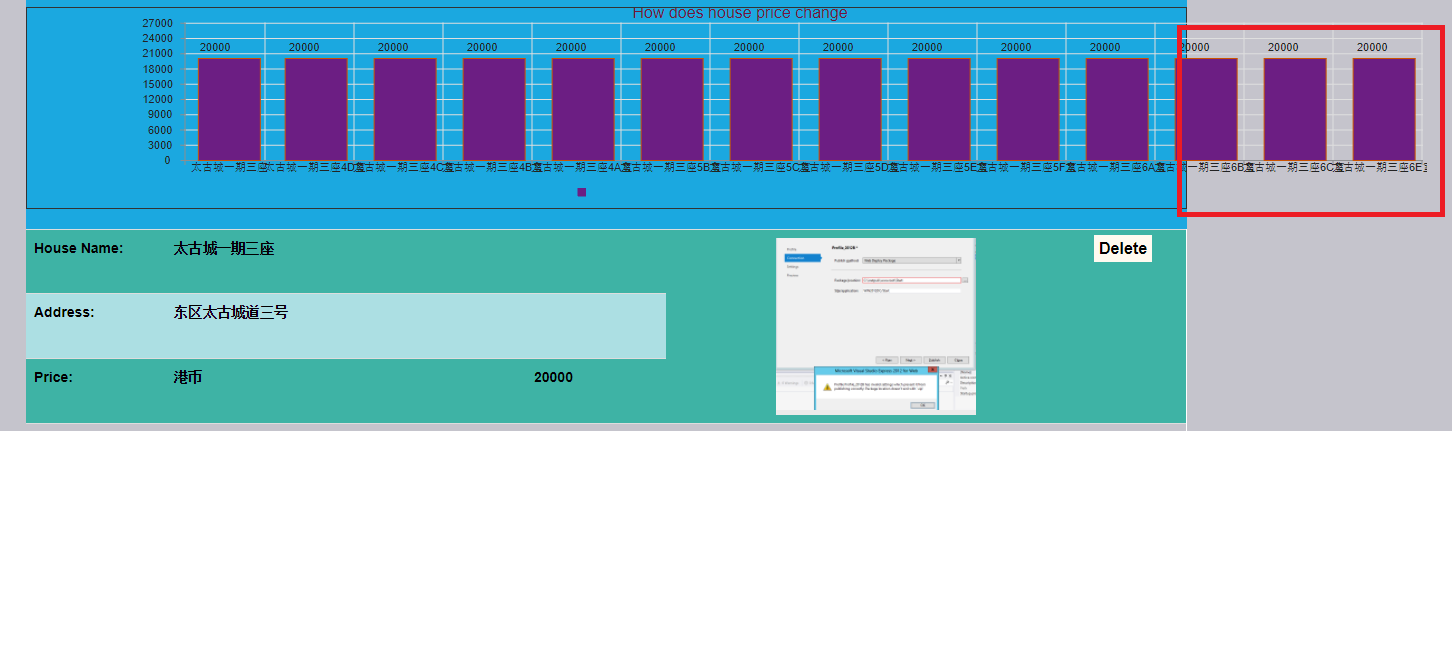
Sorry to that I still cannot change position of chart to highlighted place below.

Sorry to that I still cannot change position of chart to highlighted place below.
need to see aspx code
just move your chart on top of houses div
<div id=housesChart>
  <AjaxToolkit:Barchart ....></AjaxToolkit:Barchart>
</div>

<div id=houses>...house data comes here dynamically...</div>
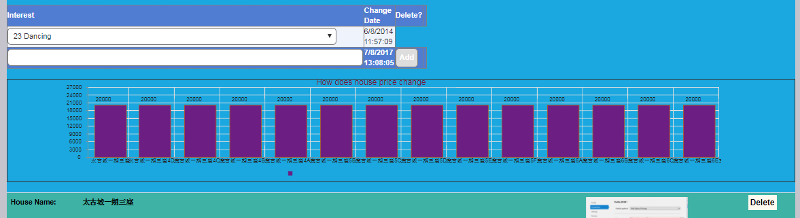
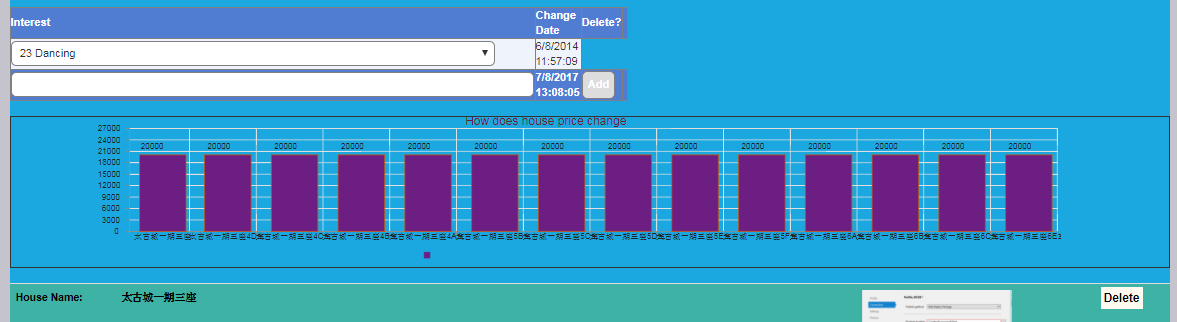
Do you want it like this?

Then move your BarChart div below the GridView1 and set the width to 100%
Then move your BarChart div below the GridView1 and set the width to 100%
ASKER
Hi HainKurt,
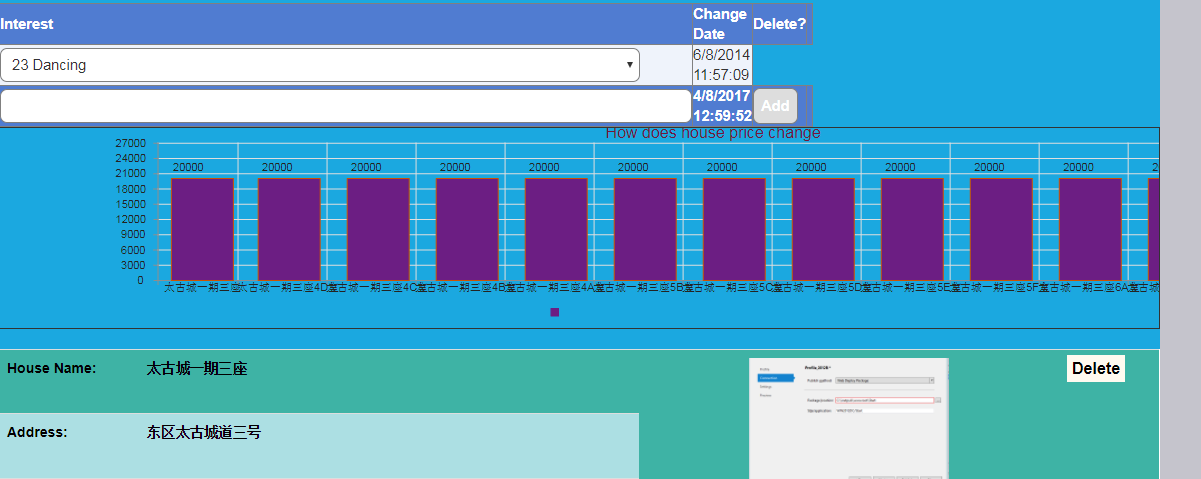
I want to ensure the chart is having same width to the list (or row) right underneath it. Where to adjust it?
I want to ensure the chart is having same width to the list (or row) right underneath it. Where to adjust it?

looks like it is working fine, press Ctrl+F5
or clear your cache
or clear your cache
ASKER
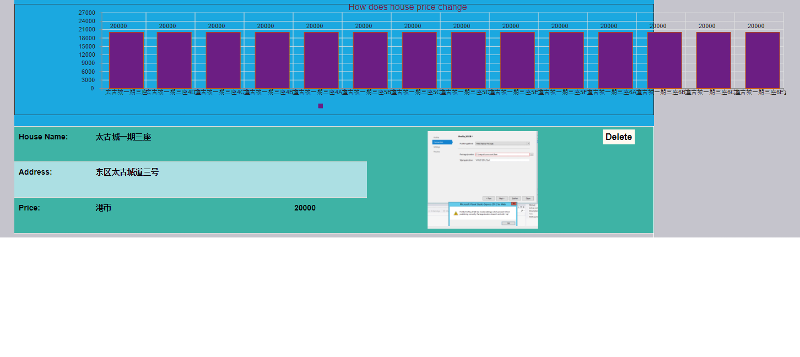
I press Ctrl-F5 but no help. I want to ensure the highlighted part below is removed by adjusting the width of the chart

I dont see any issue
clear your cache
also, you can make back color white as
clear your cache
also, you can make back color white as
<div id="housesChart" style="width:100%;background-color: white;">
...
</div>
ok,I guess my screen is big, thats why...
somewhere you have 1400 (maybe ChartWidth="1400" in ajax barchart asp.net element) in your code...
make it "100%" or "auto"
somewhere you have 1400 (maybe ChartWidth="1400" in ajax barchart asp.net element) in your code...
make it "100%" or "auto"
to adjust width you have to show less number of bars and give 100% with to bar chart.
ASKER
How to adjust number of Bars? Thanks a lot
those are your data...
check ajaxcontroltoolkit:barchar
http://www.ajaxcontroltoolkit.net/BarChart/BarChart.aspx
add/remove data series...
check ajaxcontroltoolkit:barchar
http://www.ajaxcontroltoolkit.net/BarChart/BarChart.aspx
add/remove data series...
ASKER
Thanks. And are you sure that you don't have the problem like me, with your big screen? Can I see your screenshot?
my screen is big, and I dont see any issue...
but as I said, you set something to 1400... find it and change to 100%
but as I said, you set something to 1400... find it and change to 100%
ASKER
Sorry, I could not find out 1400 within the whole solution.
please share your aspx page code.
ok, it may not be set
then add/try these in barchart
ChartWidth="100%"
ChartWidth="auto"
ChartWidth="*"
then add/try these in barchart
ChartWidth="100%"
ChartWidth="auto"
ChartWidth="*"
ASKER
HainKurt,
I've put
but there is no help, after re-deployment.
I've put
BarChart1.Width = Unit.Percentage(100);but there is no help, after re-deployment.
it is still set to 1400px
what is aspx code?
put this to aspx control
ChartWidth="100%"
what is aspx code?
put this to aspx control
ChartWidth="100%"
ASKER
Can you please show with the full line to it? Thanks a lot
you should post your aspx code...
ASKER
Here is the line
    <div id="housesChart" style="width:100%;">
        <ajaxToolkit:BarChart runat="server" ID="BarChart1"></ajaxToolkit:BarChart>
    </div>
why did not you add this?
ChartWidth="100%"
ChartWidth="100%"
<div id="housesChart" style="width:100%;">
        <ajaxToolkit:BarChart runat="server" ID="BarChart1" ChartWidth="100%"></ajaxToolkit:BarChart>
</div>ASKER
I put that but problem persists, after re-deployment.
add it and see what happens...
I guess even 100% will not work as intended since, chart is prepared on server...
and 100% does not mean anything on server...
but you can add a small size on server as:
try above and lets see what will happen...
and 100% does not mean anything on server...
but you can add a small size on server as:
<div id="housesChart" style="width:100%;">
  <ajaxToolkit:BarChart runat="server" ID="BarChart1" ChartWidth="720"></ajaxToolkit:BarChart>
</div>try above and lets see what will happen...
ASKER
Sorry, problem persists, after re-deployment.
I dont see any change...
please every time you make change, post that code as well since we cannot see your aspx code...
please every time you make change, post that code as well since we cannot see your aspx code...
ASKER
FYI
    <div id="housesChart" style="width:100%;">
        <ajaxToolkit:BarChart runat="server" ID="BarChart1" ChartWidth="720"></ajaxToolkit:BarChart>
    </div>
looks like you did not upload the page to the server
I dont see any change...
add a height as well...
I dont see any change...
add a height as well...
    <div id="housesChart" style="width:100%;">
        <ajaxToolkit:BarChart runat="server" ID="BarChart1" ChartWidth="720" ChartHeight="300"></ajaxToolkit:BarChart>
</div>ASKER
Yes, height is taking effect but width is NOT.
ASKER CERTIFIED SOLUTION
membership
This solution is only available to members.
To access this solution, you must be a member of Experts Exchange.
ASKER
To current change, I put the codes, per the given example and I search whole solution and do not see "1400".
what is your code that deals with this BarChart (code behind - c#/VB.Net code)?
* and suddenly it is changed to 720px!!!
* and suddenly it is changed to 720px!!!
ASKER
Yes, it is due to last 2 lines below. NOw it is too squeezing and how to adjust it?
                string[] x = new string[dt.Rows.Count];
                decimal[] y = new decimal[dt.Rows.Count];
                for (int i = 0; i < dt.Rows.Count; i++)
                {
                    x[i] = dt.Rows[i][0].ToString();
                    y[i] = Convert.ToInt32(dt.Rows[i][1]);
                }
                ...

                //if (x.Length > 3)
                    //BarChart1.ChartWidth = (x.Length * 100).ToString();
just use
and adjust width & height from here!
how many series you will have here?
<div id="housesChart" style="width:100%;">
  <ajaxToolkit:BarChart runat="server" ID="BarChart1" ChartWidth="720" ChartHeight="300"></ajaxToolkit:BarChart>
</div>and adjust width & height from here!
how many series you will have here?
ASKER
No. of series is related to number of records being picked up, right? How to adjust it to make it demonstrate the data better?
I dont know what you need here...
if you want a fixed width just use aspx code...
if you have 100 data, then you cannot fit into a small area...
maybe you can put it into a scrollable div, and make bar width fixed...
if you want a fixed width just use aspx code...
if you have 100 data, then you cannot fit into a small area...
maybe you can put it into a scrollable div, and make bar width fixed...
BarChart1.ChartWidth = (x.Length * 100)ASKER
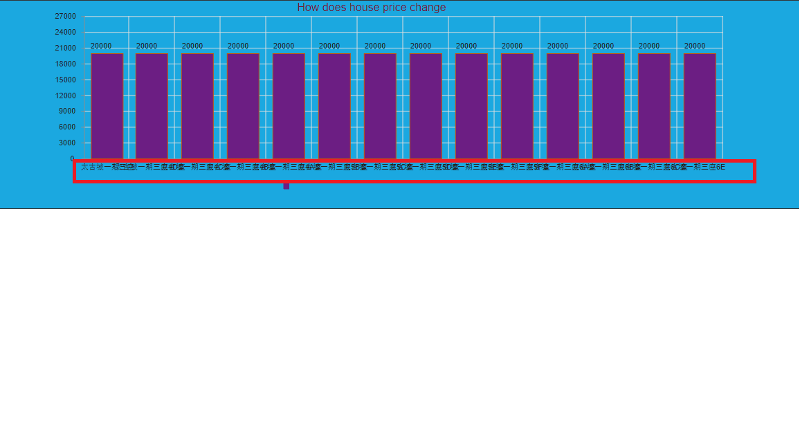
I mean the wording below is rather squeezing and how to make it better?
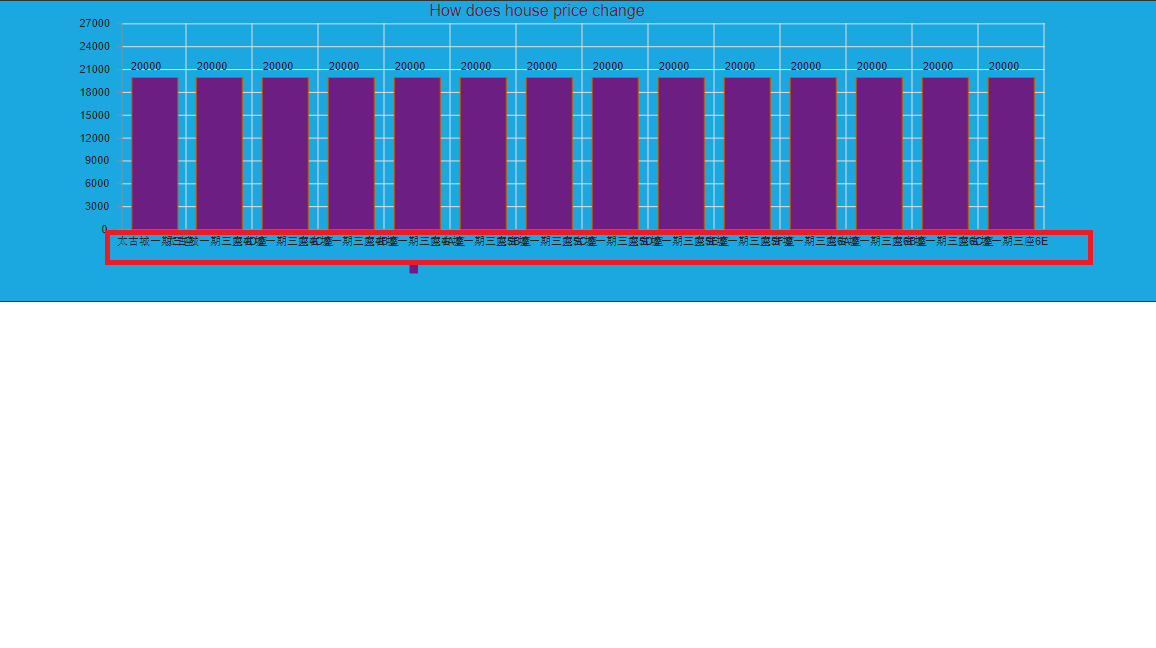
you should know "how to make it better" :)
14 long text on one line\ how can it be better?
use short text - 4A 2B 3C...
use horizantal chart
play with css and make text as vertical (not sure even if this is possible)
but again as always, this should be another question...
14 long text on one line\ how can it be better?
use short text - 4A 2B 3C...
use horizantal chart
play with css and make text as vertical (not sure even if this is possible)
but again as always, this should be another question...
ASKER
I've raised
https://www.experts-exchange.com/questions/29049032/Problem-to-chart.html
you can see it if available. Thanks a lot.
https://www.experts-exchange.com/questions/29049032/Problem-to-chart.html
you can see it if available. Thanks a lot.