Bad query performance / odd index behavior (I assume)
Having a really odd issue with a report for a client.
Running 2008R2, database is smallish, only like 3-4GB. Largest table for OrderDetails is around 4 million rows.
Server is a bit underpowered, but not horrible, and in most cases performs fine.
One query on a velocity report is stumping me.
The inner query, executed by itself, which doing most of the heavy lifting, returns in a fraction of a second.
Joined with the outer one, I usually end up killing after about 5 - 6 minutes of runtime.
If I put the inner query into a temp table, and run from there instead of the subquery, again in a fraction of a second.
If i LEAVE the subquery in, and remove the "UnitsOfMeasure" table, AGAIN a fraction of a second.
Units of measure is by a longshot the smallest table of the entire group, not sure where to even start looking on where the issue is.
There are a few indexes with some fragmentation, but not the UOM one.
Any thoughts are appreciated.
Running 2008R2, database is smallish, only like 3-4GB. Largest table for OrderDetails is around 4 million rows.
Server is a bit underpowered, but not horrible, and in most cases performs fine.
One query on a velocity report is stumping me.
declare	@StartDate date = '2016-10-01',
	@EndDate date = '2017-11-01',
	@ClientID int = 3282


select p.ProductName, u.UOM, x.TimesOrdered as [Times Ordered], x.TotalQuantity as [Total Qty], x.TotalPrice as [Total Price], x.AverageQuantity as [Avg Qty], x.AveragePrice as [Avg Price]
from (
	select od.ProductID, od.UOMID, count(1) as TimesOrdered, sum(od.Quantity) as TotalQuantity, sum(od.Quantity * od.Price) as TotalPrice, avg(od.Quantity) as AverageQuantity, avg(od.Price) as AveragePrice
	from Orders o
	join OrderDetails od on o.OrderID = od.OrderID
	join ProductUOMs pu on pu.ProductID = od.ProductID and pu.UOMID = od.UOMID
	where ClientID = @ClientID and o.Active = 1 and o.Status = 1 and od.Active = 1 and o.OrderDate between @StartDate and @EndDate
	group by od.ProductID, od.UOMID
) x
join Products p on x.ProductID = p.ProductID
join UnitsOfMeasure u on x.UOMID = u.UOMID
order by p.ProductName, u.UOMThe inner query, executed by itself, which doing most of the heavy lifting, returns in a fraction of a second.
Joined with the outer one, I usually end up killing after about 5 - 6 minutes of runtime.
If I put the inner query into a temp table, and run from there instead of the subquery, again in a fraction of a second.
If i LEAVE the subquery in, and remove the "UnitsOfMeasure" table, AGAIN a fraction of a second.
Units of measure is by a longshot the smallest table of the entire group, not sure where to even start looking on where the issue is.
There are a few indexes with some fragmentation, but not the UOM one.
Any thoughts are appreciated.
PortletPaul
Can you get and attach an execution plan file (.sqlplan)?
ASKER
For sure, already had them actually but forgot to attach.
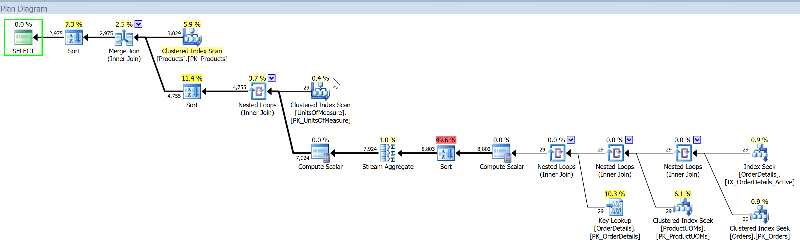
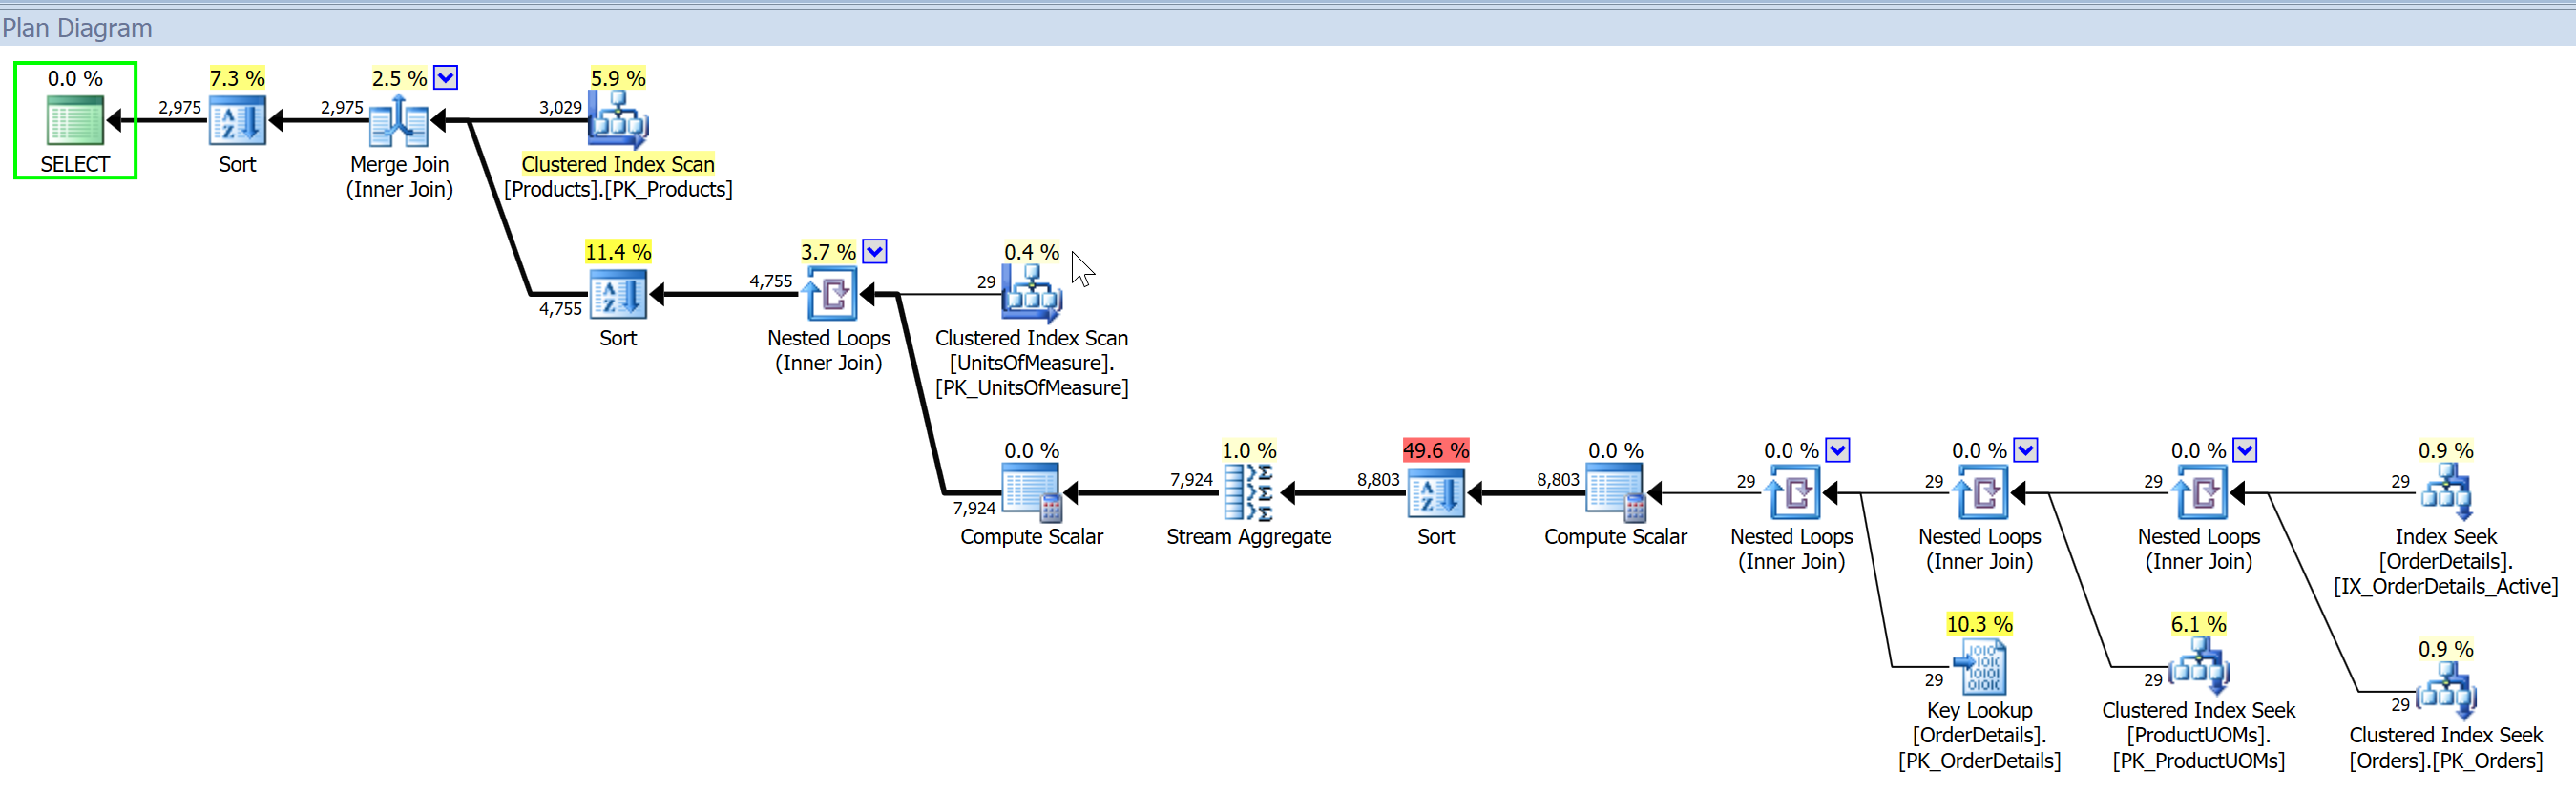
These are only the estimated plans, client is still in use so I can't run the real plan on the problem query yet.
3 of them on there, "FullQuery" which is the problem one, "InterimTable" which is when I take the subquery out and put it into a holding table first, and "NoUOM" which is the same as full but without adding in the UOM table.
Thanks.
FullQuery.sqlplan
InterimTableQuery.sqlplan
NoUOMQuery.sqlplan
You don't seem to use this table: join ProductUOMs pu on pu.ProductID = od.ProductID and pu.UOMID = od.UOMID
It is in the subquery but not used anywhere that I can see.
How does this perform?
It is in the subquery but not used anywhere that I can see.
How does this perform?
      SELECT
            od.ProductID
          , u.UOM
          , COUNT(1)                    AS TimesOrdered
          , SUM(od.Quantity)            AS TotalQuantity
          , SUM(od.Quantity * od.Price) AS TotalPrice
          , AVG(od.Quantity)            AS AverageQuantity
          , AVG(od.Price)               AS AveragePrice
      FROM Orders o
      JOIN OrderDetails od ON o.OrderID = od.OrderID
      JOIN UnitsOfMeasure u ON od.UOMID = u.UOMID
      WHERE ClientID = @ClientID
      AND o.Active = 1
      AND o.Status = 1
      AND od.Active = 1
      AND o.OrderDate BETWEEN @StartDate AND @EndDate
      GROUP BY
            od.ProductID
, u.UOMASKER
It's not really being used in that query, it's more of a safeguard.
They have the ability to change that "ProductUOM". This is for a produce company, so that's the link to say for example Head Lettuce is sold by the "Case" and by "Pound". They may change that to "Piece" instead of pound, which for some reason they then do NOT want the pounds to show in the report.
And the query above returned very quickly.
There's a small fraction of times where they do actually have duplicated UOM names, which is why I was hesitant to group by the name instead of the ID... but unlikely it would be an issue for a single product.
I'm still just SUPER curious as to what in the hell the bottleneck is as the query was?
according the to full execution plan it is using an index scan, but it isn't an expensive operation
ASKER
Few things if it helps at all:
1) The actual report is in a stored proc, so my first thought was parameter sniffing issues, but all the plans I sent were running direct queries NOT in the proc, so I don't think that's the case.
2) Some of the more fragmented indexes ARE on the PKs for Orders and OrderDetails, but I would have expected that to cause the perf issues on the inner query, not when I joined to the small tables after that.
3) Their office is off for an hour or so, so I was able to wait for the full one to execute. Real execution plan and client stats are attached.
REALFullQuery.sqlplan
ClientStats.png
ASKER
And my mistake, OrderDetails is not. It's only at about 0.5% fragmentation, Orders is around 43%.
But same confusion, I would have expected that to have impact on the inner query.
And FYI, thanks a lot for the assist.
But same confusion, I would have expected that to have impact on the inner query.
And FYI, thanks a lot for the assist.
The od.UOMID could be retained in the select & group by if needed.
I'm unable to do much more, perhaps others can. Note I an NOT a DBA.
I'm unable to do much more, perhaps others can. Note I an NOT a DBA.
We cross over on posts.
I sense you have this well under control. Good luck, happy to help (not that I did much).
Cheers, Paul
I sense you have this well under control. Good luck, happy to help (not that I did much).
Cheers, Paul
ASKER
Thanks man, and no worries. I'll reach out.
Really appreciate the effort ;)
Really appreciate the effort ;)
do you still have issues? is it ok now?
and is the inner select running very fast?
do you have appropriate indexes on all tables (all columns on joins)?
what is happening if you comment out last line, order statement?
and is the inner select running very fast?
do you have appropriate indexes on all tables (all columns on joins)?
what is happening if you comment out last line, order statement?
ASKER
No, issues are still there. I can get around the issue with making a temp table, and fix the problem, I'm more concerned / curious on why the problem is happening.
Indexes are on all tables and joins, in this particular case, almost everything involved is a PK.
Tried removing ordering before, zero difference. It really seems to only be on the full system when I bring in UOMs (the smallest table).
And yes, the inner query returns in almost no time at all.
Indexes are on all tables and joins, in this particular case, almost everything involved is a PK.
Tried removing ordering before, zero difference. It really seems to only be on the full system when I bring in UOMs (the smallest table).
And yes, the inner query returns in almost no time at all.
what about
is it fast?
what about this? I moved "od.Active = 1" to join...
select count(1) from ( ... inner select here ...)is it fast?
what about this? I moved "od.Active = 1" to join...
select count(*) from (
	select od.ProductID, od.UOMID, count(1) as TimesOrdered, sum(od.Quantity) as TotalQuantity, sum(od.Quantity * od.Price) as TotalPrice, avg(od.Quantity) as AverageQuantity, avg(od.Price) as AveragePrice
	from Orders o
	join OrderDetails od on o.OrderID = od.OrderID and and od.Active = 1
	join ProductUOMs pu on pu.ProductID = od.ProductID and pu.UOMID = od.UOMID
	where ClientID = @ClientID and o.Active = 1 and o.Status = 1 and o.OrderDate between @StartDate and @EndDate
	group by od.ProductID, od.UOMID
) xASKER
But that's still the inner query. That's the one I would have figured was the problem, as it's doing most of the work on the heavy joins on much larger tables. And as the query is, THAT one is returning in about 0.1 of a second.
It's when I bring in that to the outer query that the bottleneck happens. And as per above, the issue ONLY happens when the UnitsOfMeasure table is brought in, which has about 50 rows in it.
Hence the total confusion.
It's when I bring in that to the outer query that the bottleneck happens. And as per above, the issue ONLY happens when the UnitsOfMeasure table is brought in, which has about 50 rows in it.
Hence the total confusion.
did you run the count queries, are they fast?
@ ID: 42329328
@ ID: 42329328
what is the total count on
1. inner select
2. Products
3. UnitsOfMeasure
normally we should order them from smaller to larger :)
1. inner select
2. Products
3. UnitsOfMeasure
normally we should order them from smaller to larger :)
ASKER
The count on the entire query (not just the sub you hinted at, but the problem one) does return very fast.
The subquery results in 98 rows.
Products (whole table) has 3029.
UnitsOfMeasure has 29.
So why would the count return that fast when actually rendering results is that bad?
The subquery results in 98 rows.
Products (whole table) has 3029.
UnitsOfMeasure has 29.
So why would the count return that fast when actually rendering results is that bad?
what about this query?
select p.ProductName, u.UOM, x.TimesOrdered as [Times Ordered], x.TotalQuantity as [Total Qty], x.TotalPrice as [Total Price], x.AverageQuantity as [Avg Qty], x.AveragePrice as [Avg Price]
  from Products p
 inner join (
       select od.ProductID, od.UOMID, count(1) as TimesOrdered, sum(od.Quantity) as TotalQuantity, sum(od.Quantity * od.Price) as TotalPrice, avg(od.Quantity) as AverageQuantity, avg(od.Price) as AveragePrice
         from Orders o
        inner join OrderDetails od on o.OrderID = od.OrderID and od.Active = 1
        inner join ProductUOMs pu on pu.ProductID = od.ProductID and pu.UOMID = od.UOMID
        where ClientID = @ClientID and o.Active = 1 and o.Status = 1 and o.OrderDate between @StartDate and @EndDate
        group by od.ProductID, od.UOMID
       ) x on x.ProductID = p.ProductID
 inner join UnitsOfMeasure u on x.UOMID = u.UOMID
 order by p.ProductName, u.UOM
The subquery results in 98 rows.
Products (whole table) has 3029.
UnitsOfMeasure has 29
with these numbers, even without any index, query should not take more than a few seconds :)
is there any lock on tables? restart the server...
ASKER
Still executing... on and on and on. So same issue.
ASKER
Sorry, responded to the last one before I saw the recent.
That's what's tripping me up. There's zero reason I can see why the tiny UOM table could POSSIBLY effect the query that badly.
Everywhere there should be a bottleneck, there isn't one. Only that small table.
Server was rebooted this morning, no difference.
Indexes seem fine, I'm totally lost.
That's what's tripping me up. There's zero reason I can see why the tiny UOM table could POSSIBLY effect the query that badly.
Everywhere there should be a bottleneck, there isn't one. Only that small table.
Server was rebooted this morning, no difference.
Indexes seem fine, I'm totally lost.
but if we moved the UOM table into the inner query: it is fast... correct? (& we can retain the od.UOMID in the logic)
Another thing to try would be to place your existing inner query into a CTE which may have a similar effect as a temp table.
By the way, it is the Order Details table that is large according to the execution plan for the REAL Full query.
      SELECT
            od.ProductID
          , od.UOMID
          , u.UOM
          , COUNT(1)                    AS TimesOrdered
          , SUM(od.Quantity)            AS TotalQuantity
          , SUM(od.Quantity * od.Price) AS TotalPrice
          , AVG(od.Quantity)            AS AverageQuantity
          , AVG(od.Price)               AS AveragePrice
      FROM Orders o
      JOIN OrderDetails od ON o.OrderID = od.OrderID
      JOIN UnitsOfMeasure u ON od.UOMID = u.UOMID
      WHERE ClientID = @ClientID
      AND o.Active = 1
      AND o.Status = 1
      AND od.Active = 1
      AND o.OrderDate BETWEEN @StartDate AND @EndDate
      GROUP BY
            od.ProductID
          , od.UOMID
, u.UOMAnother thing to try would be to place your existing inner query into a CTE which may have a similar effect as a temp table.
By the way, it is the Order Details table that is large according to the execution plan for the REAL Full query.
By the way, it is the Order Details table that is large according to the execution plan for the REAL Full query.
looks like ortder and orderdetails table are huge, 2-3 millions each...
products is like 3K
the others are tiny, lookup tables...
I am assuming we have some corrupt indexes here...
rebuilding all indexes may solve the issue
and one more thing
even creating a new table as
and using this in the query did not solve the issue...
using CTE did not solve the issue...
using CTE and left join solved the issue...
this one worked fine
I am guessing we have issues with some indexes here...
even creating a new table as
select * into UnitsOfMeasure2 from UnitsOfMeasureand using this in the query did not solve the issue...
using CTE did not solve the issue...
using CTE and left join solved the issue...
this one worked fine
with x as (
       select od.ProductID, od.UOMID, count(1) as TimesOrdered, sum(od.Quantity) as TotalQuantity, sum(od.Quantity * od.Price) as TotalPrice, avg(od.Quantity) as AverageQuantity, avg(od.Price) as AveragePrice
         from Orders o
        inner join OrderDetails od on o.OrderID = od.OrderID and od.Active = 1
        inner join ProductUOMs pu on pu.ProductID = od.ProductID and pu.UOMID = od.UOMID
        where ClientID = @ClientID and o.Active = 1 and o.Status = 1 and o.OrderDate between @StartDate and @EndDate
        group by od.ProductID, od.UOMID
)
select p.ProductName, u.UOM, x.TimesOrdered as [Times Ordered], x.TotalQuantity as [Total Qty], x.TotalPrice as [Total Price], x.AverageQuantity as [Avg Qty], x.AveragePrice as [Avg Price]
  from Products p
  left join x on x.ProductID = p.ProductID
  left join UnitsOfMeasure u on x.UOMID = u.UOMID
order by p.ProductName, u.UOMI am guessing we have issues with some indexes here...
ASKER CERTIFIED SOLUTION
membership
This solution is only available to members.
To access this solution, you must be a member of Experts Exchange.
ASKER
Wow, thanks a tonne Scott. The hash returns instantly.
So basically (if I got that), because OrderDetails does have a clustered index on the ID column, SQL is isn't able to properly pick out that there's only a tiny subset of rows that would actually be coming back, and is making it's plan badly?
Results from the query are attached as an Excel. Looking forward to digging more into that script to see what you're doing.
Much appreciated.
you forgot the attachment
ASKER
Thanks Paul, thought I had, maybe for some reason it got blocked. In any case, worked this time.
IndexResults.xlsx
IndexResults.xlsx
ASKER
Thanks again Scott. Would be curious about the results of the stats I posted, but you gave me a killer starting point to hunt down what's going wrong.
Incredible query to pull the indexing issues, still going through that, but found quite a few issues already.
Much appreciated.
Incredible query to pull the indexing issues, still going through that, but found quite a few issues already.
Much appreciated.
I will post it as soon as I can. I'm really busy at work and moving houses IRL.
ASKER
No worries, and no problem even if you don't.
As I said, what you provided gave me more than enough to start looking (and finding) issues.
As I said, what you provided gave me more than enough to start looking (and finding) issues.