Trying to figure out how to create a crosstab query using Excel file
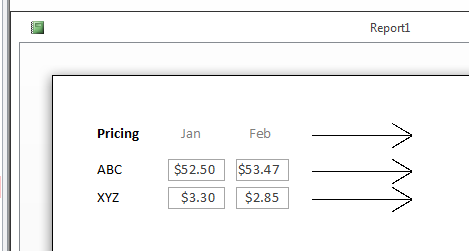
Please see the attached Excel file. I'm trying to figure out how to create a crosstab query that will give me the data for a report that looks like this:
 Pricing-Example-File.xlsx
 Pricing-Example-File.xlsx
ASKER
This is an Access question. I cannot alter the Excel file which really is an Access table. I only put it together in Excel to show what the table looks like.
Did you try the crosstab wizard? Since you are having a problem with Access, it would be better to post pictures of the "Access" problem.
If your question is - how do I get the 12 month names in month order? Then the answer is, use the Column headings property. But a word of warning. When you use column headings you never get any data that doesn't match one of the headings. This isn't a problem with months because there's only 12 of them and they don't change but if you wanted department headings for example and you wanted them in some order other than alphabetical so you decided to use the column headings property, if the data contained a department that wasn't defined in the column headings list, the data for that department would not be included in the report.
One more caveat. Make sure your select query includes a selection by year otherwise you mush data for all years into each month's column.
ASKER
Attached: Sample Access file/table.
PricingExample.accdb
PricingExample.accdb
You didn't even try.
ASKER
Not true. I did and what I tried did not work. I don't understand cross-tab queries.
What happened when you ran the wizard?
ASKER
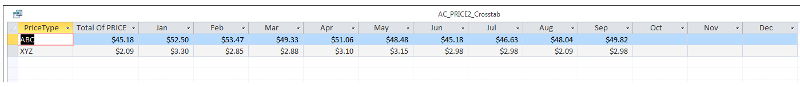
See attached. Not even close.
PricingExample2.accdb
PricingExample2.accdb
Then this goes back to the old concept of "Normalization"
Your raw data is not in the correct format to give you what you are looking for (easily).
If your data were in the more appropriate format, like this:
ID MONTH_DATE PRICE PriceType
1 1/1/2017 $52.50 ABC
2 2/1/2017 $53.47 ABC
3 3/1/2017 $49.33 ABC
4 4/1/2017 $51.06 ABC
5 5/1/2017 $48.48 ABC
6 6/1/2017 $45.18 ABC
7 7/1/2017 $46.63 ABC
8 8/1/2017 $48.04 ABC
9 9/1/2017 $49.82 ABC
10 1/1/2017 $3.30 XYZ
11 2/1/2017 $2.85 XYZ
12 3/1/2017 $2.88 XYZ
13 4/1/2017 $3.10 XYZ
14 5/1/2017 $3.15 XYZ
15 6/1/2017 $2.98 XYZ
16 7/1/2017 $2.98 XYZ
17 8/1/2017 $2.09 XYZ
18 9/1/2017 $2.98 XYZ
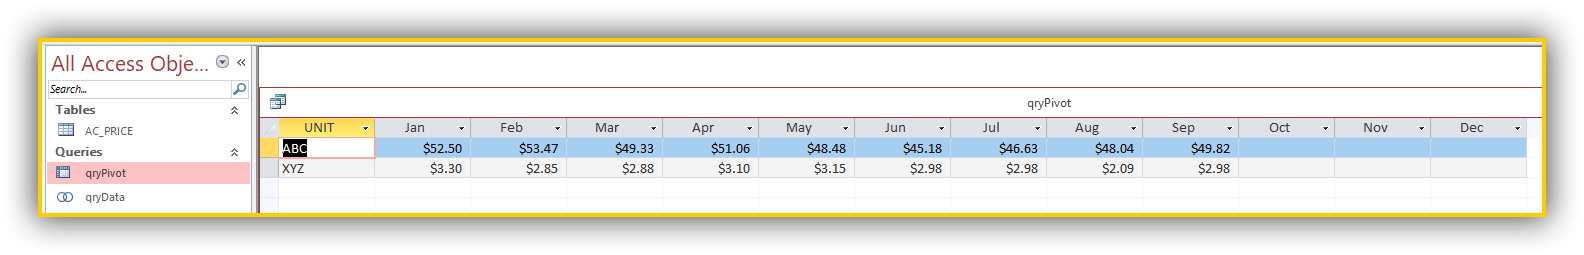
...Then your crosstab would simply be this:
...and it would look like this:
 ...easy peasy lemon squeezy
;-)
As with all un-normalized data, ...if left in the incorrect format, ...you will always have to jump though endless hoops to get the data to do things that are ridiculously simple, ...if the data were in the correct format.
For example, if the data is left un-normailzed you would have to make a report in design view:
...and create all the textboxes and lables that your layout example requires.
...then set all the Monthly textboxes to have a controlsource of something like this:
(for example: ABC_Price for January 1st 2017):
=DLookUp("ABC_PRICE","AC_P
(again, ...changing the Field and the Date arguments for *every single textbox*)
Then you get something like what you are after:
"that will give me the data for a REPORT"
;-)
JeffCoachman
Your raw data is not in the correct format to give you what you are looking for (easily).
If your data were in the more appropriate format, like this:
ID MONTH_DATE PRICE PriceType
1 1/1/2017 $52.50 ABC
2 2/1/2017 $53.47 ABC
3 3/1/2017 $49.33 ABC
4 4/1/2017 $51.06 ABC
5 5/1/2017 $48.48 ABC
6 6/1/2017 $45.18 ABC
7 7/1/2017 $46.63 ABC
8 8/1/2017 $48.04 ABC
9 9/1/2017 $49.82 ABC
10 1/1/2017 $3.30 XYZ
11 2/1/2017 $2.85 XYZ
12 3/1/2017 $2.88 XYZ
13 4/1/2017 $3.10 XYZ
14 5/1/2017 $3.15 XYZ
15 6/1/2017 $2.98 XYZ
16 7/1/2017 $2.98 XYZ
17 8/1/2017 $2.09 XYZ
18 9/1/2017 $2.98 XYZ
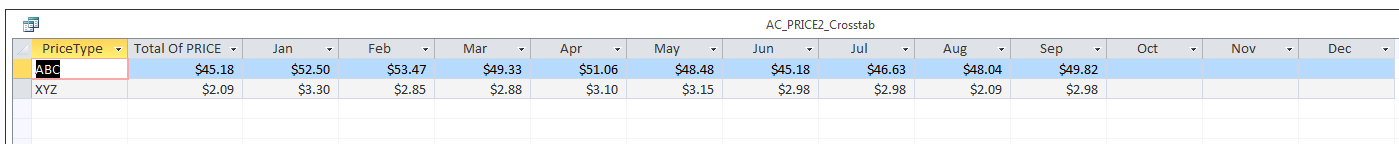
...Then your crosstab would simply be this:
TRANSFORM First(AC_PRICE2.PRICE) AS FirstOfPRICE
SELECT AC_PRICE2.PriceType, First(AC_PRICE2.PRICE) AS [TotalOf PRICE]
FROM AC_PRICE2
GROUP BY AC_PRICE2.PriceType
PIVOT Format([MONTH_DATE],"mmm") In ("Jan","Feb","Mar","Apr","May","Jun","Jul","Aug","Sep","Oct","Nov","Dec");...and it would look like this:
 ...easy peasy lemon squeezy
;-)
As with all un-normalized data, ...if left in the incorrect format, ...you will always have to jump though endless hoops to get the data to do things that are ridiculously simple, ...if the data were in the correct format.
For example, if the data is left un-normailzed you would have to make a report in design view:
...and create all the textboxes and lables that your layout example requires.
...then set all the Monthly textboxes to have a controlsource of something like this:
(for example: ABC_Price for January 1st 2017):
=DLookUp("ABC_PRICE","AC_P
(again, ...changing the Field and the Date arguments for *every single textbox*)
Then you get something like what you are after:
"that will give me the data for a REPORT"
;-)
JeffCoachman
SOLUTION
membership
This solution is only available to members.
To access this solution, you must be a member of Experts Exchange.
Didn't I post a database that fixed this problem for you? Perhaps it was in a different thread.
ASKER CERTIFIED SOLUTION
membership
This solution is only available to members.
To access this solution, you must be a member of Experts Exchange.
Steve,
As you can see, (from all of our posts), the lynch-pin here is that your data is not normalized.
If the other tables in this system were designed by the same DBA, ...you will have to always be going through crazy machinations to do things that are normally simple, if the data was properly structured.
JeffCoachman
SOLUTION
membership
This solution is only available to members.
To access this solution, you must be a member of Experts Exchange.
ASKER
Pat had posted the solution 3 days ago. I had missed it.
Pat had posted the solution 3 days ago. I had missed it.
What comment is that in this thread, I don't see it?
»bp
ASKER
I am terribly mixed up and confused, I have asked the moderator to re-open the topic so I can re-assign points.
There may be more than one thread on this topic.
ASKER
You all either posted a solution or offered very good insight. Thank you.
OK
;-)
;-)
Looking at the Excel sheet you provided, Excel has the capability called Pivot Tables to do what you want. But to do that you need to get your data in an easier format for the tool to work with. So I first created a new sheet, "flattening" your sample data into a more database design, looking like:
EE29066341.xlsx
»bp