kwarden13
asked on
Best way to normalize and weight Data?
I have some data I am trying to normalize/ weight. I have 4 regions, the number of people who have missing training certificates, and number of people in the region. Originally I was going to divide number of missing training certificate by number of people for each region to normalize the data. However, the data looks really small when I do that - like 100/40000. I don’t really want to graph such small numbers but need some way to bring in the number of people. Should I multiply by 100 and then just say this data is per 100 employees? Would that make sense?
Any other suggestions?
Any other suggestions?
First of all: There is no "best way". This would mean using a preferred scale. Which resembles bias.
In the first case it is okay, cause you don't have (introduce) further relevant structure.
In the second case, mostly not. Cause it implies that your companies have at least an average of 100 employees. It also raises questions about distribution. How many companies do you have per region? How is the employee average per region?
BUT: you can multiply it by 100 for representing the result in percent or multiply it by 1000 for per mill.
Just my 2¢.
Should I multiply by 100 and then just say this data is per 100 employees? Would that make sense?Is the data based on only one company or many?
In the first case it is okay, cause you don't have (introduce) further relevant structure.
In the second case, mostly not. Cause it implies that your companies have at least an average of 100 employees. It also raises questions about distribution. How many companies do you have per region? How is the employee average per region?
BUT: you can multiply it by 100 for representing the result in percent or multiply it by 1000 for per mill.
Just my 2¢.
Originally I was going to divide number of missing training certificate by number of people for each region to normalize the data
This is not normalization. Normalization would be the number of missing training certificate per region diveded by the total of the number missing training certificate over all regions.
And weighting would mean:
the number of missing training certificate per region multiplied by the number of people in the region devided by the total number of people all regions.
the number of missing training certificate per region multiplied by the number of people in the region devided by the total number of people all regions.
ASKER
Here is the data I am trying to weight relative to # of people in the region. I was going to do the following formula to employees per region into consideration.
Missing Certificates/ (ppl in region/sum(all ppl in region))
or
(Missing Certificates/ppl in region) *1000 - this would be missing certificates per 1,000 people
Does this make sense?
sample_data.xlsx
Missing Certificates/ (ppl in region/sum(all ppl in region))
or
(Missing Certificates/ppl in region) *1000 - this would be missing certificates per 1,000 people
Does this make sense?
sample_data.xlsx
I don't see what the first formula should represent. The second is just the (average) ratio per mill. So I think you're looking for the green numbers.
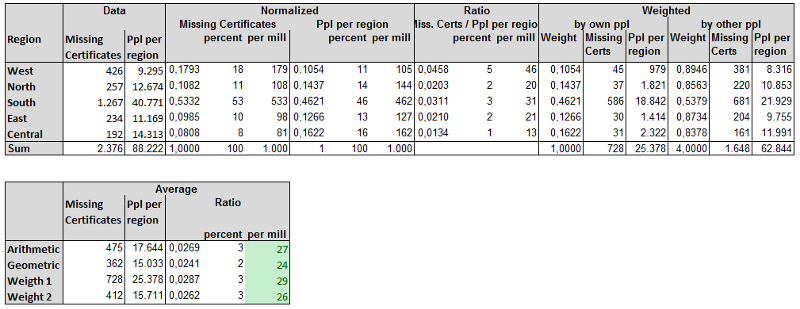
Weights can have any value. The most "natural" weight is the ratio number people own region to sum people all regions. The second "natural" weight is "inverse", the ratio sum of people of other regions to sum people all regions.
The weighted averages are an weighted arithmetic average.
The geometric average is a control number. The geometric average favors small numbers, thus it is useful when we think the error in larger groups is greater than in smaller groups.
sample_data.xlsx
ASKER
Hi Ste5an-
Thank you for the outputs. I am still a little confused. So I was doing the following:
1) #of missing certificates per person which I guess is the ratio. # of missing certs/# of ppl in region. Could I just multiply that by 1,000 to get # of missing certs per 1,000 people in that region. I don't want to report such a small number like .0458.
2) Also, I am confused by the weighted section above. Not understanding by own people and other people. I am trying to figure out the best way to represent the number of missing certificates relative to headcount.
ASKER CERTIFIED SOLUTION
membership
This solution is only available to members.
To access this solution, you must be a member of Experts Exchange.
ASKER
This was a great explanation!
Open in new window