Microsoft SQL Server
--
Questions
--
Followers
Top Experts
as it related to SQL server counters..
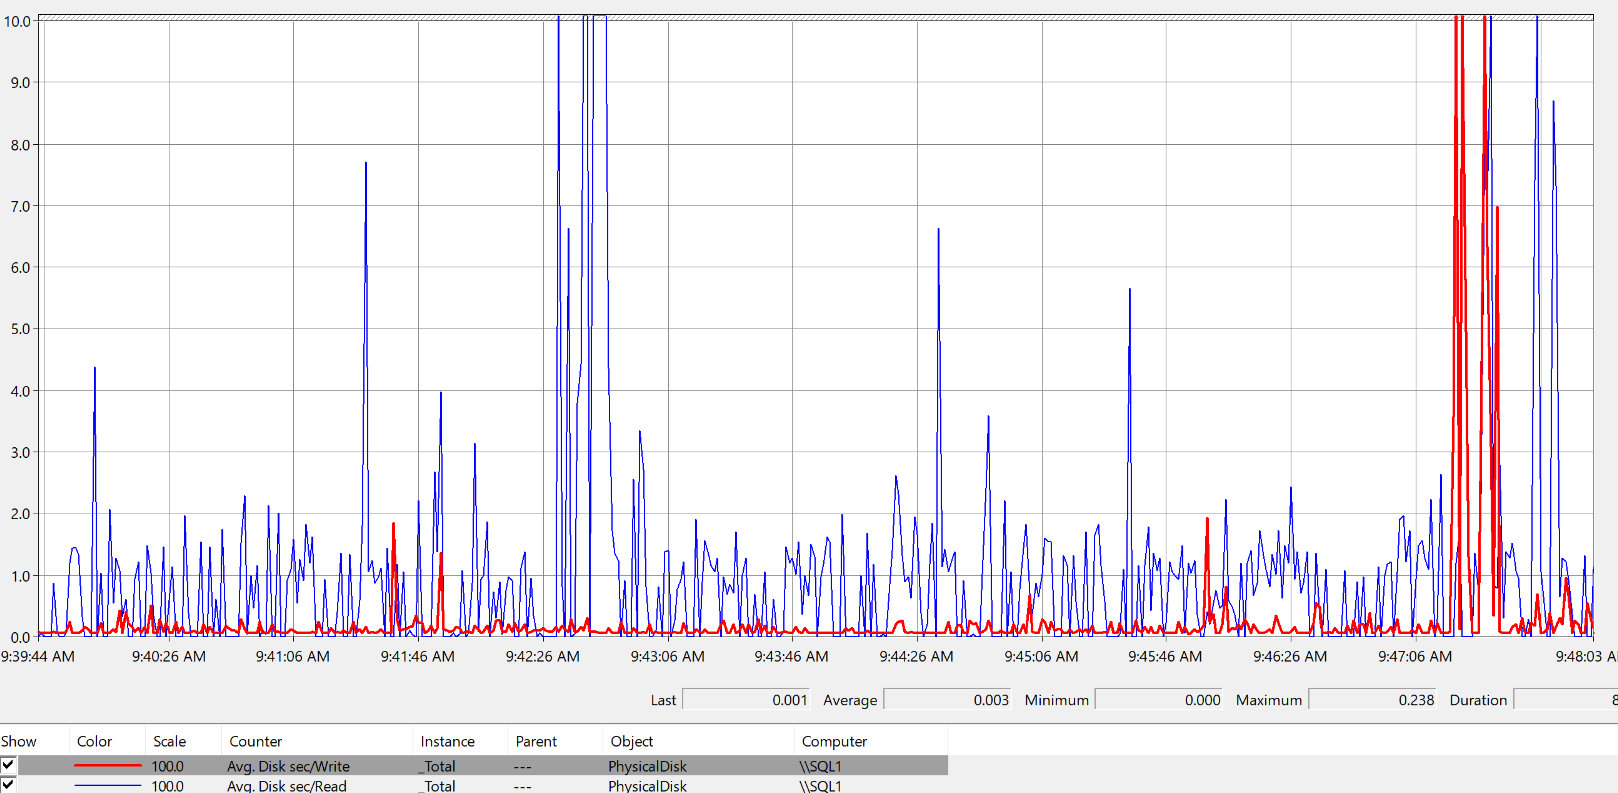
In the following graphic, you can see the 2 counters I'm capturing, for purposes of seeing SQL server I/O for Reads/Writes needing to go to Disk, instead of getting them from buffer memory.
My question is, since I've set the vertical scale to 100, and the counters are both displaying in ms, is it correct to say the Avg Disk sec/Write(in RED) is mostly
staying below 10ms?
and the Reads(in BLUE) are mainly above 10ms, even going off the chart a few times..?
In this
Zero AI Policy
We believe in human intelligence. Our moderation policy strictly prohibits the use of LLM content in our Q&A threads.
Can we then focus on the question of graph / scale/ interpretation?
To restate even more plainly: how can I best display the graph to show counters that
output in milliseconds, where I'm looking to show say, values from 0 to 100ms?
So you should use another counter: https://blogs.technet.micr
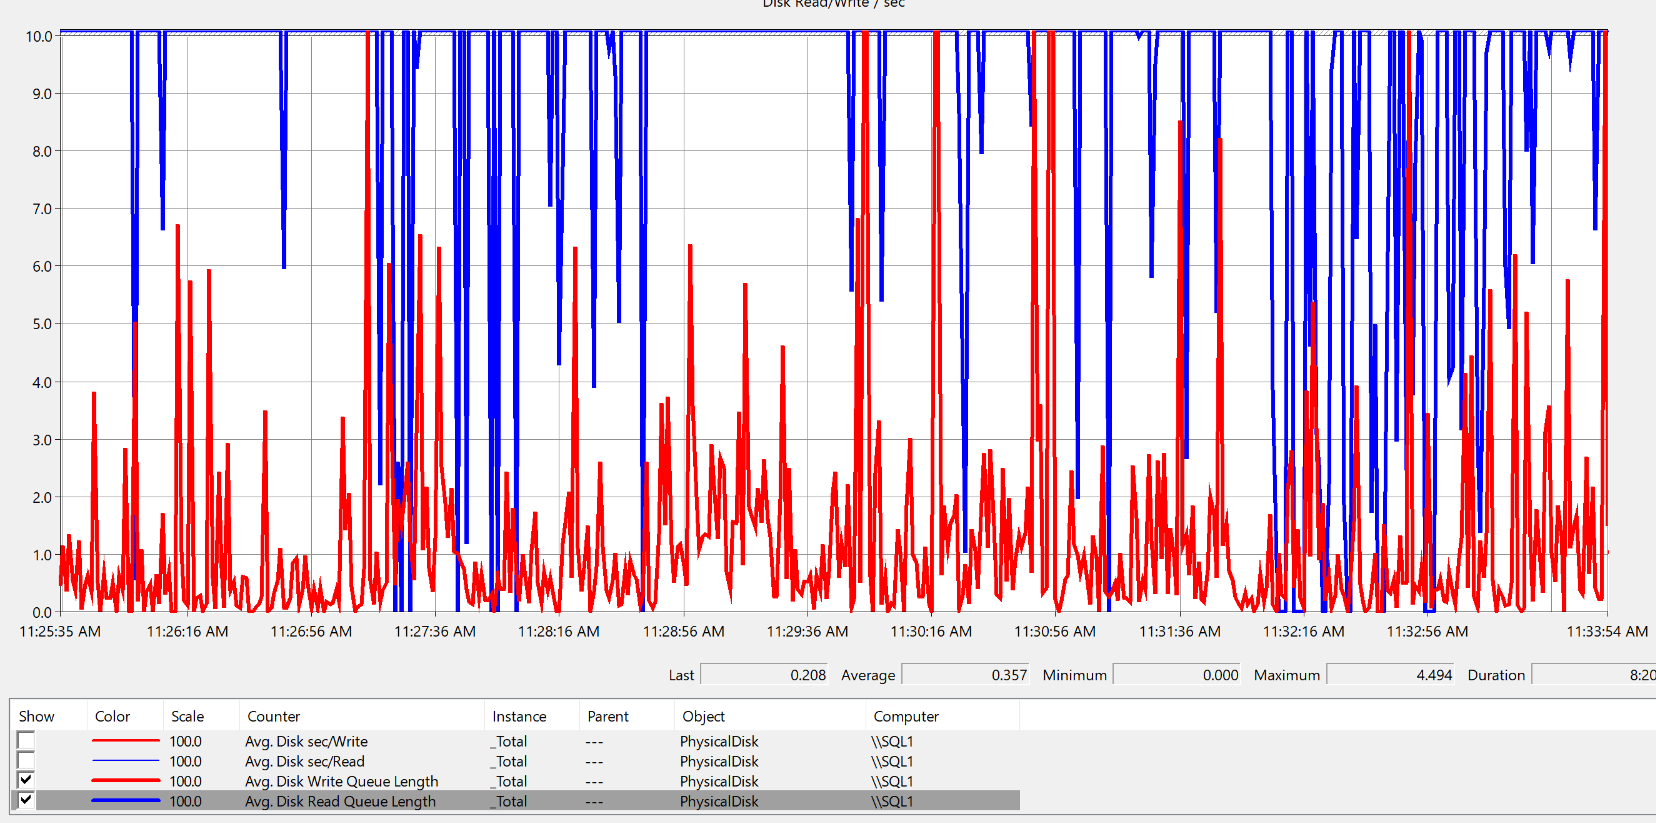
why does the read counter appear to go downward?
and are they both well over the 1 or 2 you mentioned, much of the time?


EARN REWARDS FOR ASKING, ANSWERING, AND MORE.
Earn free swag for participating on the platform.
Get a FREE t-shirt when you ask your first question.
We believe in human intelligence. Our moderation policy strictly prohibits the use of LLM content in our Q&A threads.
Microsoft SQL Server
--
Questions
--
Followers
Top Experts
Microsoft SQL Server is a suite of relational database management system (RDBMS) products providing multi-user database access functionality.SQL Server is available in multiple versions, typically identified by release year, and versions are subdivided into editions to distinguish between product functionality. Component services include integration (SSIS), reporting (SSRS), analysis (SSAS), data quality, master data, T-SQL and performance tuning.