php script not rendering google multiple line chart.
I want to get a graph that displays multiple line charts using google charts, but the attached script is not rending anything. It shows blank web page.nAAT_Pole_Trend.php
I am quite new to google charts. When I do view page source I get the following below. I don't know what I am doing wrong here.
<!doctype html>
<html>
<head>
<script src="https://www.gstatic.com/charts/loader.js"></script>
<script src="http://ajax.googleapis.com/ajax/libs/jquery/3.2.1/jquery.min.js"></script>
</head>
<body>
<div id="chart" style="width: 900px; height: 500px"></div>
<script>
google.charts.load('curren
google.charts.setOnLoadCal
function drawChart(){
var data = new google.visualization.DataT
data.addColumn('date','Wee
data.addColumn('number','C
data.addColumn('number','P
data.addColumn('number','W
data.addRows([
[[0],0,9,9],
[[0],0,11,20],
[[1],1,1,20],
[[0],0,3,23],
[[0],0,1,24],
[[3],3,34,55],
[[0],0,2,57],
[[0],0,22,79],
[[0],0,20,99],
[[3],3,17,113]
]);
var options = {
title: 'Pole Trend - NBN QLD',
legend: { position: 'bottom' },
width: 900,
height: 500,
vAxis: {title: 'Number of Poles'},
hAxis: {format: 'Y-m-d', title: 'Weeks' }
};
var chart = new google.visualization.LineC
chart.draw(data, options);
}
</script>
</body>
</html>
Check this out
<!doctype html>
<html>
<head>
<script src="https://www.gstatic.com/charts/loader.js"></script>
<script src="http://ajax.googleapis.com/ajax/libs/jquery/3.2.1/jquery.min.js"></script>
</head>
<body>
<div id="chart" style="width: 900px; height: 500px"></div>
<script>
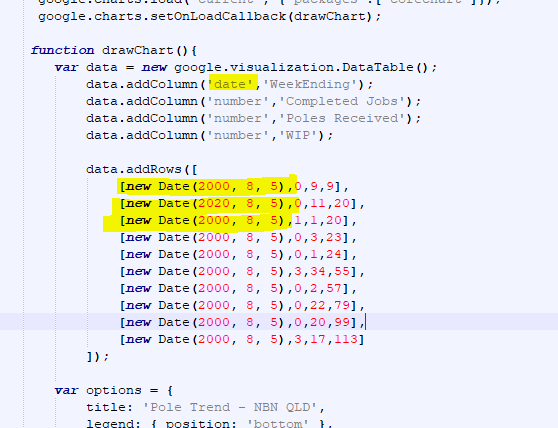
google.charts.load('current', {'packages':['corechart']});
google.charts.setOnLoadCallback(drawChart);
function drawChart(){
var data = new google.visualization.DataTable();
data.addColumn('date','WeekEnding');
data.addColumn('number','Completed Jobs');
data.addColumn('number','Poles Received');
data.addColumn('number','WIP');
data.addRows([
[new Date(2000, 8, 5),0,9,9],
[new Date(2020, 8, 5),0,11,20],
[new Date(2000, 8, 5),1,1,20],
[new Date(2000, 8, 5),0,3,23],
[new Date(2000, 8, 5),0,1,24],
[new Date(2000, 8, 5),3,34,55],
[new Date(2000, 8, 5),0,2,57],
[new Date(2000, 8, 5),0,22,79],
[new Date(2000, 8, 5),0,20,99],
[new Date(2000, 8, 5),3,17,113]
]);
var options = {
title: 'Pole Trend - NBN QLD',
legend: { position: 'bottom' },
width: 900,
height: 500,
vAxis: {title: 'Number of Poles'},
hAxis: {format: 'Y-m-d', title: 'Weeks' }
};
var chart = new google.visualization.LineChart(document.getElementById('chart'));
chart.draw(data, options);
}
</script>
</body>
</html>
Check out this data types addrows
[https://developers.google.com/chart/interactive/docs/datesandtimes]
[https://developers.google.com/chart/interactive/docs/datesandtimes]
This question needs an answer!
Become an EE member today
7 DAY FREE TRIALMembers can start a 7-Day Free trial then enjoy unlimited access to the platform.
View membership options
or
Learn why we charge membership fees
We get it - no one likes a content blocker. Take one extra minute and find out why we block content.
data.addRows([
[[0],0,9,9],
[[0],0,11,20],
[[1],1,1,20],
[[0],0,3,23],
[[0],0,1,24],
[[3],3,34,55],
[[0],0,2,57],
[[0],0,22,79],
[[0],0,20,99],
[[3],3,17,113]
]);
Please refer below for details on how to put date value.
https://developers.google.com/chart/interactive/docs/datatables_dataviews