cwbarrett
asked on
Question on Creating a Chart with Total Value on a Particular Date
Hi:
I am trying to create a simple 2-D bar chart in Access 2010. There are several thousand records with the following fields: [Effective_Date], [Cancel_Date], and [Amount] ($). Records represent contracts that may span 1 to 30 years between Effective_Date and Cancel_Date. What I am looking to do is show on December 31 of each year (from 1986 to current year) the total dollar value of contracts in effect on that day using the chart tool.
I have created charts for gains & losses in any one year but can't seem to put my head around this.
Any help is appreciated.
Charlie
ASKER CERTIFIED SOLUTION
membership
This solution is only available to members.
To access this solution, you must be a member of Experts Exchange.
This will take some steps:
First, create a query that will list your contract years:
Then, create and save a helper-function, that will calculate the yearly share of the total budget:
Finally, create a crosstab query that will display the yearly budgets for all contracts:
Alternatively, if that is what your graph requires, simply list the sum of the yearly budgets:
First, create a query that will list your contract years:
SELECT DISTINCT
    Year(DMin("[Effective_Date]","[Contract]"))+10*Abs([Deca].[id] Mod 10)+Abs([Uno].[id] Mod 10) AS [Year]
FROM
    MSysObjects AS Uno,
    MSysObjects AS Deca
WHERE
    Year(DMin("[Effective_Date]","[Contract]"))+10*Abs([Deca].[id] Mod 10)+Abs([Uno].[id] Mod 10) <=
Year(DMax("[Cancel_Date]","[Contract]"));Then, create and save a helper-function, that will calculate the yearly share of the total budget:
Public Function AmountShare( _
    ByVal StartDate As Date, _
    ByVal EndDate As Date, _
    ByVal BudgetYear As Integer, _
    ByVal Amount As Currency) _
    As Currency

    Dim Budget      As Currency
    Dim Primo       As Date
    Dim Ultimo      As Date
    Dim Days        As Integer
    Dim AllDays     As Integer

    Primo = DateSerial(BudgetYear, 1, 1)
    Ultimo = DateSerial(BudgetYear, 12, 31)

    If Primo <= StartDate And EndDate <= Ultimo Then
        ' One year or less.
        Budget = Amount
    ElseIf StartDate > Ultimo Or EndDate < Primo Then
        ' Outside this year.
        Budget = 0
    Else
        AllDays = DateDiff("d", StartDate, EndDate)
        Days = DatePart("y", Ultimo)

        If StartDate < Primo And Ultimo < EndDate Then
            ' Full year.
        ElseIf StartDate >= Primo And Ultimo < EndDate Then
            ' Partial year.
            Days = Days - DatePart("y", StartDate)
        ElseIf StartDate < Primo And EndDate < Ultimo Then
            ' Partial year.
            Days = DatePart("y", EndDate)
        End If

        Budget = Amount * Days / AllDays
    End If

    AmountShare = Budget

End FunctionSELECT
Contract.ID,
ContractYear.Year,
Contract.Effective_Date,
Contract.Cancel_Date,
Contract.Amount,
AmountShare([Effective_Date],[Cancel_Date],[Year],[Amount]) AS AmountYear
FROM
ContractYear,
Contract
WHERE
ContractYear.Year Between Year([Effective_Date]) And Year([Cancel_Date])
ORDER BY
Contract.ID,
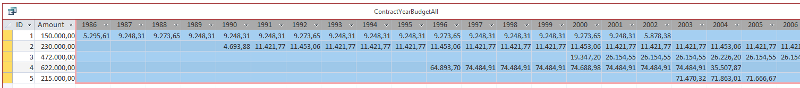
ContractYear.Year;Finally, create a crosstab query that will display the yearly budgets for all contracts:
TRANSFORM
    Sum(ContractYearBudget.AmountYear) AS SumOfAmountYear
SELECT
    ContractYearBudget.ID,
    ContractYearBudget.Amount
FROM
    ContractYearBudget
GROUP BY
    ContractYearBudget.ID,
    ContractYearBudget.Amount
PIVOT
    ContractYearBudget.Year;
Alternatively, if that is what your graph requires, simply list the sum of the yearly budgets:
SELECT
    ContractYearBudget.Year,
    Sum(ContractYearBudget.AmountYear) AS YearTotal
FROM
    ContractYearBudget
GROUP BY
ContractYearBudget.Year;ASKER
Thank you everyone. Dale, your solution worked great especially with the 2nd post using date(). There was one bug however. The Effective_Date field is never null but the Cancel_date has many Null values so the query needed "Cancel_Date Or Is Null" in that part of the SQL to get the correct totals.
Thank for your help.
Charlie
Thank for your help.
Charlie
Glad I could point you in the right direction, and you were able to get it to work from there.
Don't forget to close out the question.
Don't forget to close out the question.
ASKER
Thank you!
SELECT tbl_Years.yr, sum(yourTable.Amount) as AsOfYrEnd
FROM tbl_Years, yourTable
WHERE yourTable.Effective_Date <= DateSerial(tbl_Years.yr, 12, 31)
AND yourTable.Cancel_Date >= DateSerial(tbl_Years.yr, 12, 31)
GROUP BY tbl_Years.yr