Needs Help Transferring Array Count Data To Barchart
Hi all,
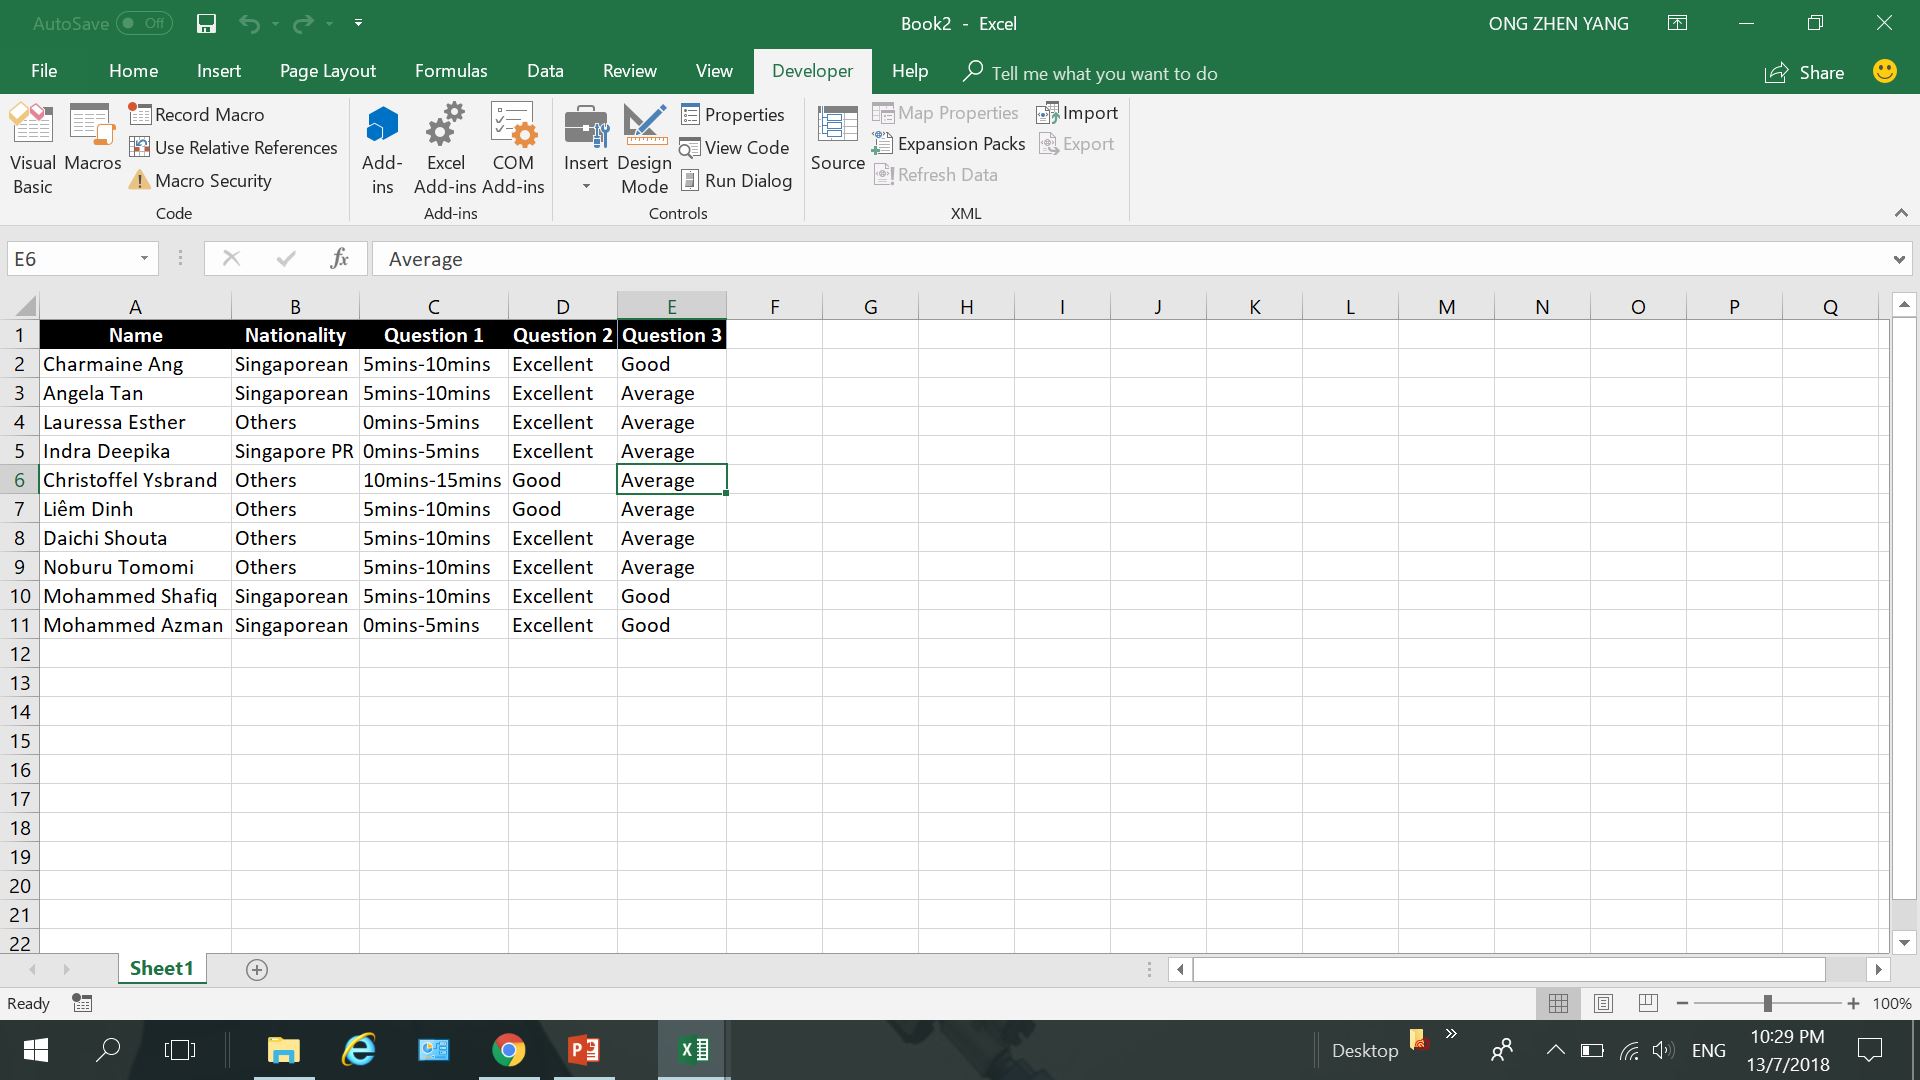
The responses are taken from Question 1 and Question 2 's columns respectively
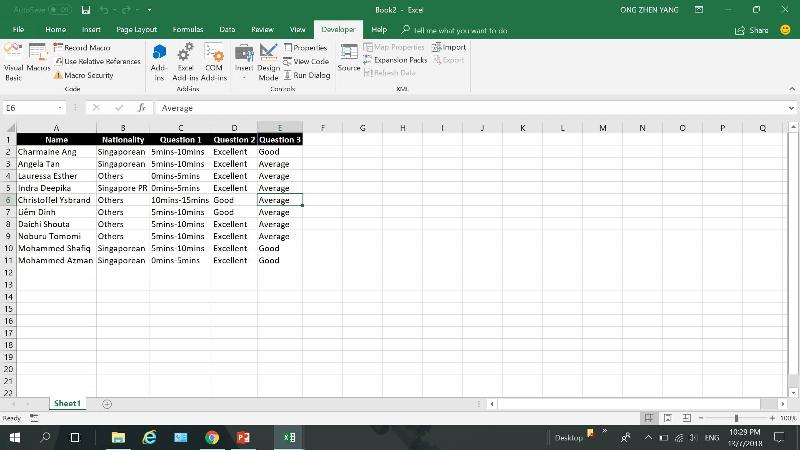
I have this code and it works as I want it to, since the messagebox values are correct. However, I was hoping that someone can help me delete and edit the messagebox part of the code as I now want to use the array count to make a barchart/histogram.
I have attached an example file. Any help is much aprreciated! :)
Book2.xlsm
The responses are taken from Question 1 and Question 2 's columns respectively
I have this code and it works as I want it to, since the messagebox values are correct. However, I was hoping that someone can help me delete and edit the messagebox part of the code as I now want to use the array count to make a barchart/histogram.
Sub GetArrayCount()

Dim Ws As Worksheet
Dim LRow As Long, i As Long
Dim r As New Collection, a
Dim DataRng1 As Range, DataRng2 As Range
Dim MyArr() As Variant

Set Ws = Worksheets("Sheet1")
LRow = Ws.Range("A" & Rows.Count).End(xlUp).Row
Set DataRng1 = Ws.Range("D2:D11" & LRow)
Set DataRng2 = Ws.Range("E2:E11" & LRow)
MyArr = Array("Average", "Excellent", "Good", "Poor")

Application.ScreenUpdating = False

For Each a In MyArr
    r.Add a, a
Next a
For i = 1 To r.Count
    MsgBox Ws.Range("Q2").Value & "Q1 " & r(i) & " - " & Application.WorksheetFunction.CountIf(DataRng1, r(i))

Next
For i = 1 To r.Count
 MsgBox Ws.Range("Q3").Value & "Q2 " & r(i) & " - " & Application.WorksheetFunction.CountIf(DataRng2, r(i))
Next
Application.ScreenUpdating = True
End SubI have attached an example file. Any help is much aprreciated! :)
Book2.xlsm
ASKER
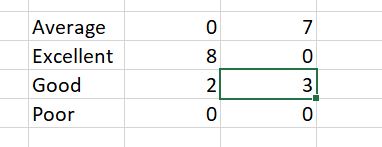
The output looks like this now.
Can you edit the code so it will look like this instead
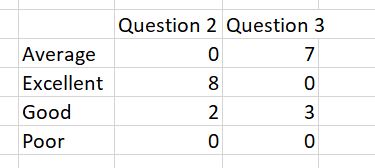
Can you edit the code so it will look like this instead
Sub GetArrayCount()

Dim Ws As Worksheet
Dim LRow As Long, i As Long
Dim r As New Collection, a
Dim DataRng1 As Range, DataRng2 As Range
Dim MyArr() As Variant

Set Ws = Worksheets("Sheet1")
LRow = Ws.Range("A" & Rows.Count).End(xlUp).Row
Set DataRng1 = Ws.Range("D2:D" & LRow)
Set DataRng2 = Ws.Range("E2:E" & LRow)
MyArr = Array("Average", "Excellent", "Good", "Poor")

Application.ScreenUpdating = False

For Each a In MyArr
    r.Add a, a
Next a
With Range("G2")
    .Offset(0, 1) = "Question 2"
    .Offset(0, 2) = "Question 3"
    For i = 1 To r.Count
            .Offset(i, 0) = r(i)
            .Offset(i, 1) = Application.WorksheetFunction.CountIf(DataRng1, r(i))
            .Offset(i, 2) = Application.WorksheetFunction.CountIf(DataRng2, r(i))
    Next
End With
Application.ScreenUpdating = True
End SubASKER
Okay thank you very much! :)
I will leave the thread open for a while longer to see if there is any other solutions.
I will leave the thread open for a while longer to see if there is any other solutions.
I do not understand. What do you mean by other solutions?
If there is something else you should mention it. If there is nothing else then you should close the question.
If there is something else you should mention it. If there is nothing else then you should close the question.
Do you want the bar chart also to be coded?
ASKER
It would be great if you can code the bar chart too! :)
And I meant to keep it open to see if there are any other methods or code variations
And I meant to keep it open to see if there are any other methods or code variations
ASKER CERTIFIED SOLUTION
membership
This solution is only available to members.
To access this solution, you must be a member of Experts Exchange.
ASKER
Okay thank you! How do i change the range in which the data is extracted from for the bar chart? :)
You don't. You only change where the data goes (on line 21).
The code takes care of the rest on line 37.
ASKER
Oh okay! Thank you very much :)
Open in new window