Asp.net c# code for Dynamic Custom Data Point on Multi-line Chart
Asp.net c# code for Dynamic Custom Data Point on Multi-line Chart
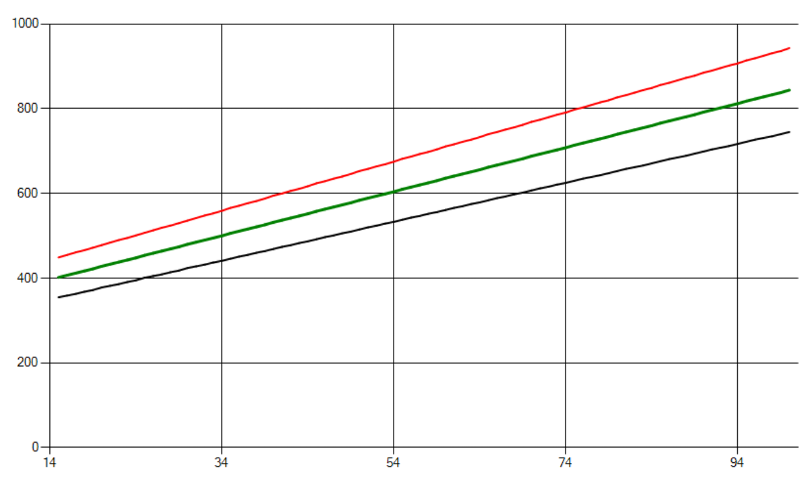
I created a multi-line chart using visual studio 2010 with c# coding for a web application for a report .
The chart is depicted in the attached image file.
There is a need for me to insert a custom data point where a vertical line from a particular point x axis intersects a horizontal line from a particular point on y axis meet. For example, in the attached image chart, I wish to have a data point depicted by a colored filled circle or square a point where vertical line from 34 on x axis intersects with horizontal line from 700 on y axis. This should be done by coding as points on x and y axes change in different situations for which report will be generated. Even the filled color of circle or square should change dynamically as per the data driving the chart
ASKER CERTIFIED SOLUTION
membership
This solution is only available to members.
To access this solution, you must be a member of Experts Exchange.
At the end of the day, you just need to add another series to the chart. That series should provide the data and visual configuration for those points.
Note: You haven't shared any of the code or data that you're using to create this chart. We also don't know what widget/plug-in/extension you're using for this. If you want something more than conceptual advice you're going to need to share that first.