Numerical Reasoning - graph
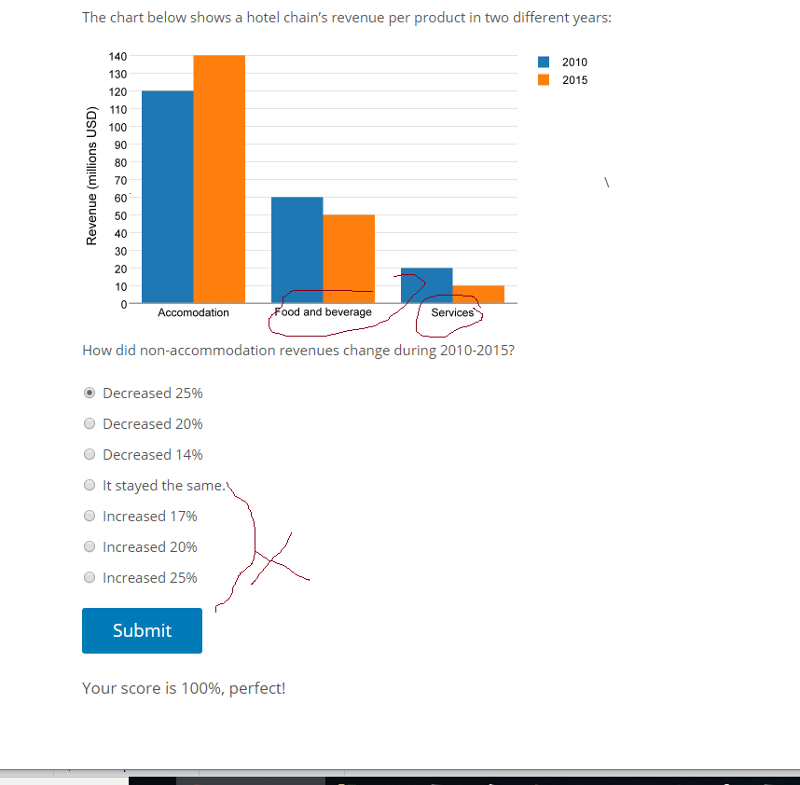
The answer is 25% decrease. From the graph, I eliminated the 4 answers because the graph for "food and beverages" and "services" has decreased.
Why is it 25%? For example, food & Beverages went from 60 Million to 50 Million and Services went from 20 million to 10 million. I wanted to say... what percentage of 50 million is less than 60 million...
Why is it 25%? For example, food & Beverages went from 60 Million to 50 Million and Services went from 20 million to 10 million. I wanted to say... what percentage of 50 million is less than 60 million...

ASKER CERTIFIED SOLUTION
membership
This solution is only available to members.
To access this solution, you must be a member of Experts Exchange.
ASKER