Windows 2016 Data Center VM Crashes
Windows 2016 Data Center.
VMWare VCenter ESXI 6.5
Exchange 2016 CU 10 Enterprise.
I have a DAG setup with 2 Nodes
NODE 2 crashes every so often
I get these event errors
Log Name: System
Source: MSExchange Server
Date: 3/23/2019 2:22:29 PM
Event ID: 9009
Task Category: General
Level: Warning
Keywords: Classic
User: N/A
Computer: TGCS021-N2.our.network.tgc
Description:
Microsoft Exchange Server 'TGCS021-N2' initiated bug check for server 'TGCS021-N2'. (Source: ActiveMonitoring, Identity: ServiceHealthActiveManager
<GroupThrottlingResult IsPassed="true" TotalRequestsSent="2" TotalRequestsSucceeded="2"
<ServerStats>
<TGCS021-N2 TotalSearched="0" MostRecentEntryStartTimeUt
<TGCS021-N1 TotalSearched="0" MostRecentEntryStartTimeUt
</ServerStats>
</GroupThrottlingResult>, Reason: Responder initiated)
Event Xml:
<Event xmlns="http://schemas.microsoft.com/win/2004/08/events/event">
<System>
<Provider Name="MSExchange Server" />
<EventID Qualifiers="32768">9009</E
<Level>3</Level>
<Task>1</Task>
<Keywords>0x80000000000000
<TimeCreated SystemTime="2019-03-23T18:
<EventRecordID>148673</Eve
<Channel>System</Channel>
<Computer>TGCS021-N2.our.n
<Security />
</System>
<EventData>
<Data>TGCS021-N2_TGCS021-N
<Data>2019-03-23T18:05:57.
<Data>2019-03-23T18:05:57.
<Data>ActiveMonitoring</Da
<Data>ServiceHealthActiveM
<Data><LocalThrottlingR
<GroupThrottlingResult IsPassed="true" TotalRequestsSent="2" TotalRequestsSucceeded="2"
<ServerStats>
<TGCS021-N2 TotalSearched="0" MostRecentEntryStartTimeUt
<TGCS021-N1 TotalSearched="0" MostRecentEntryStartTimeUt
</ServerStats>
</GroupThrottlingResult
<Data>Responder initiated</Data>
<Data>svchost</Data>
<Data>TGCS021-N2</Data>
<Data>TGCS021-N2</Data>
<Data>MSExchangeHMWorker</
</EventData>
</Event>
Log Name: System
Source: Microsoft-Windows-Kernel-P
Date: 3/23/2019 2:15:56 PM
Event ID: 219
Task Category: (212)
Level: Warning
Keywords:
User: SYSTEM
Computer: TGCS021-N2.our.network.tgc
Description:
The driver \Driver\WudfRd failed to load for the device SWD\WPDBUSENUM\{b70da062-6
Event Xml:
<Event xmlns="http://schemas.microsoft.com/win/2004/08/events/event">
<System>
<Provider Name="Microsoft-Windows-Ke
<EventID>219</EventID>
<Version>0</Version>
<Level>3</Level>
<Task>212</Task>
<Opcode>0</Opcode>
<Keywords>0x80000000000000
<TimeCreated SystemTime="2019-03-23T18:
<EventRecordID>148515</Eve
<Correlation />
<Execution ProcessID="4" ThreadID="432" />
<Channel>System</Channel>
<Computer>TGCS021-N2.our.n
<Security UserID="S-1-5-18" />
</System>
<EventData>
<Data Name="DriverNameLength">70
<Data Name="DriverName">SWD\WPDB
<Data Name="Status">3221226341</
<Data Name="FailureNameLength">1
<Data Name="FailureName">\Driver
<Data Name="Version">0</Data>
</EventData>
</Event>
Log Name: System
Source: Microsoft-Windows-WER-Syst
Date: 3/23/2019 2:18:36 PM
Event ID: 1001
Task Category: None
Level: Error
Keywords: Classic
User: N/A
Computer: TGCS021-N2.our.network.tgc
Description:
The computer has rebooted from a bugcheck. The bugcheck was: 0x000000ef (0xffffe6828a114080, 0x0000000000000000, 0x0000000000000000, 0x0000000000000000). A dump was saved in: C:\Windows\MEMORY.DMP. Report Id: d607026c-ff48-4d16-88b6-f5
Event Xml:
<Event xmlns="http://schemas.microsoft.com/win/2004/08/events/event">
<System>
<Provider Name="Microsoft-Windows-WE
<EventID Qualifiers="16384">1001</E
<Version>0</Version>
<Level>2</Level>
<Task>0</Task>
<Opcode>0</Opcode>
<Keywords>0x80000000000000
<TimeCreated SystemTime="2019-03-23T18:
<EventRecordID>148514</Eve
<Correlation />
<Execution ProcessID="0" ThreadID="0" />
<Channel>System</Channel>
<Computer>TGCS021-N2.our.n
<Security />
</System>
<EventData>
<Data Name="param1">0x000000ef (0xffffe6828a114080, 0x0000000000000000, 0x0000000000000000, 0x0000000000000000)</Data>
<Data Name="param2">C:\Windows\M
<Data Name="param3">d607026c-ff4
</EventData>
</Event>
Any one have an Idea
Thanks Tom
A couple of things,
You might want to Redact some of your errors, server name, domain etc etc
So, are any other servers on this host having issues? Have you checked that the server isn't overloaded. 0x000000ef is a critical process failing, which could be bought on by the CSTP times being too high thus crashing the kernel and then causing the server to reboot.
How have you configured your VM and what is the spec on your hardware. If node 2 is crashing every so often, it could be happening during an index and that causes it to fall over (seen it before)
Check your Host as well, run ESXTOP and check your times for your second node.
The other thing to do is check the hardware, drop it into maintenance mode and then run a comprehensive memory check.
Regards
Alex
ASKER
Afthab T
Do you have any plug and play/USB devices connected to the VM? NO
How many hard disks are connected in the VM? 3 Drive C Drive F and Drive G
All the hard disks are from SAN storage datastore? All My VM's are on NFS Storage
Alex
Thanks for the heads up.
So, are any other servers on this host having issues? No this is the only server having an issue with this at this time
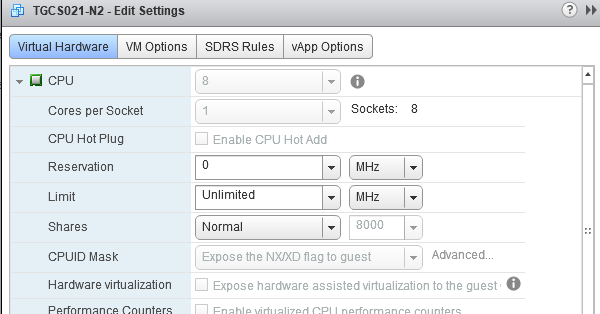
How have you configured your VM and what is the spec on your hardware the VM has 32 GB of Ram static . 8 CPU's 3 disk drives. Thin
All my VM are done the same way just have different size in mem cpus and disk size.
To Run ESXTOP I will schedule some time
To drop in Maint mode I will also have to schedule time.
Thamks
Any other ideas or suggestions welcome.
Do you have any plug and play/USB devices connected to the VM? NO
How many hard disks are connected in the VM? 3 Drive C Drive F and Drive G
All the hard disks are from SAN storage datastore? All My VM's are on NFS Storage
Alex
Thanks for the heads up.
So, are any other servers on this host having issues? No this is the only server having an issue with this at this time
How have you configured your VM and what is the spec on your hardware the VM has 32 GB of Ram static . 8 CPU's 3 disk drives. Thin
All my VM are done the same way just have different size in mem cpus and disk size.
To Run ESXTOP I will schedule some time
To drop in Maint mode I will also have to schedule time.
Thamks
Any other ideas or suggestions welcome.
Hey ya,
ESXTOP doesn't need downtime, you can just enable SSH and jump on.
How are you configuring your CPU's? As in how many cores/sockets are you using and what is the spec on your host?
The memory check could be the important one.
Thanks
Alex
ESXTOP doesn't need downtime, you can just enable SSH and jump on.
How are you configuring your CPU's? As in how many cores/sockets are you using and what is the spec on your host?
The memory check could be the important one.
Thanks
Alex
ASKER
Alex,
I activated SSH on the ESXI Host
SSH'd to the Host ran ESXTOP
What to look for??
How are you configuring your CPU's? As in how many cores/sockets are you using and what is the spec on your host?
I activated SSH on the ESXI Host
SSH'd to the Host ran ESXTOP
What to look for??
How are you configuring your CPU's? As in how many cores/sockets are you using and what is the spec on your host?
ASKER
It just crashed again this is crazy
ASKER
It is now crashing daily it is a windows 2016 issue not a VMware issue.
Need help
Need help
ASKER CERTIFIED SOLUTION
membership
This solution is only available to members.
To access this solution, you must be a member of Experts Exchange.
0x000000EF is very bad.
This means a critical process has died.
The most common reason for this is memory starvation, so RAM exhausts + then swap space fills up.
You can use directions here https://docs.microsoft.com
Analyzing your dump file will tell you about the process that died, which might relate to a primary problem (like a driver aborting).
More than likely you'll find some odd error that makes no sense, because edge conditions like all RAM + Swap exhausted are very difficult to catch + report in any useful way.
If your memory.dmp file makes no sense, look through your system logs just prior to the crash + you might find some clues as to the primary cause.
This is always a tough one to debug.
Note: I'm imagining you've installed all updates on this machine. If not, then install all updates now + see if problem clears.
To be honest,
With John's explanation that could correlate with the core setup, you're throwing your vNUMA and pNUMA all over the place, it can't process the memory assigned to it which is then causing it to crash.
Possible.
Cheers
Alex
With John's explanation that could correlate with the core setup, you're throwing your vNUMA and pNUMA all over the place, it can't process the memory assigned to it which is then causing it to crash.
Possible.
Cheers
Alex
You should be able to select 2 vCPUs, with 4 cores each, or 4 vCPUs with 2 cores each. You also want to make sure the VMWare Tools are installed on the guest.
No you can't do that, because he's on ESXi 6.5, you prioritise cores over sockets.
ASKER
Guys I will make the cpu changes tonight
Will post results
Will post results
After checking into this a bit more vNUMA doesn't come into play until the socket count is 9 or more. He is below that.
Having said that, the preferred method, based on smarter people at VMware, is to exhaust core count before incrementing socket count (as eluded to above).
So, what this means to you is:
1) Confirm the real number of cores on the Physical CPU so you don't assign more than you have.
2) Favour vCore over vCPU. So, 1 vCPU (socket), 8 cores.
Based on all the Proliants we have, we try to optimize memory lanes by evening out the socket/core counts for VMs that need performance, so we balance the sockets which in turn use different memory channels. For most, this wouldn't be really noticeable, so point 2 is fine and what VMware prefers.
ASKER
Guys on the server I see this for the CPU's
See attached image of task manager.
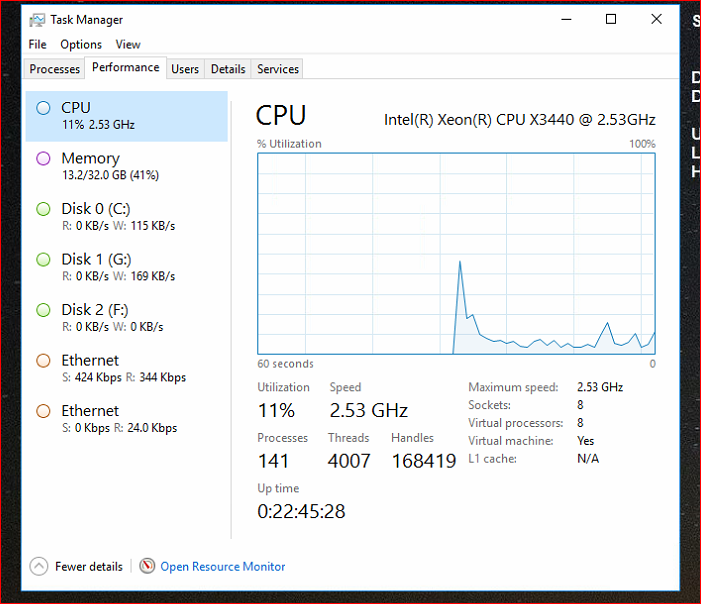
See attached image of task manager.
ASKER
Update
Server crashed today so I powered it off and changed the CPU now I have 2 sockets 8 virtual processors
Will let it run and see how it goes.
Server crashed today so I powered it off and changed the CPU now I have 2 sockets 8 virtual processors
Will let it run and see how it goes.
ASKER
Thank you guys
After changing the sockets to 4 and I changed the network adapters from E1000E to VMXNET 3 adapter.
Server has been up for several days.
After changing the sockets to 4 and I changed the network adapters from E1000E to VMXNET 3 adapter.
Server has been up for several days.
Do you have any plug and play/USB devices connected to the VM?
How many hard disks are connected in the VM?
All the hard disks are from SAN storage datastore?