What is most efficient way to copy and sort files in SQL
Hi,
I would like confirmation that I am performing data storage in the most efficient manner.
Each month I receive a csv file which has around 120 columns of data and around 10,000 rows.
Please see attached for explanation. The format looks basic but so is my SQL experience :)
If there are more easier and efficient ways of arriving at those 16 files I'd be interested to learn.
I need to keep the data size down as Excel struggles to compute hence the need for all those files.
Many thanks
Ian
SQLCopysort.xlsx
The new table you copy the selected columns to should be clustered (before being loaded) on:
( Country, Location, Distance ) /*assuming the "<60"/">59" part refers to distance, you don't really say*/
That will significantly reduce the overhead of producing the 16 output files.
( Country, Location, Distance ) /*assuming the "<60"/">59" part refers to distance, you don't really say*/
That will significantly reduce the overhead of producing the 16 output files.
ASKER
Hi Tony,
Thanks for your kind response.
Scuse my ignorance as I am a total beginner here but are you saying by the following comment that I can leave the data in a dataset in SQL and run the regressions from Excel
"Or more preferable, use as a dataset in SQL to compare to whatever you would be in your "RUN REGRESSIONS" routines."
ASKER
Hi Scott, Thanks for your quick response. Yes it was 'distance' apologies for not making clearer.
Which 'new' table are you referring to ? is it the second one down on the sheet ?
How would I go about 'clustering' ?
Thanks
Which 'new' table are you referring to ? is it the second one down on the sheet ?
How would I go about 'clustering' ?
Thanks
The table for:
CREATE UNIQUE CLUSTERED INDEX CL_table_name ON dbo.table_name ( Country, Location, Distance ) WITH ( FILLFACTOR = 99 );
Just run that command once after you create the table. From then on, before each new load, you can just TRUNCATE the table and reload it:
TRUNCATE TABLE dbo.table_name
INSERT INTO dbo.table_name WITH (TABLOCK)
SELECT A,B,C,D,E,J,M,N,P,S
FROM dbo.original_table
FRO
IN SQL I NOW COPY TO ANOTHER FILE TO ONLY INCLUDE COLUMNS A,B,C,D,E,J,M,N,P,S
CREATE UNIQUE CLUSTERED INDEX CL_table_name ON dbo.table_name ( Country, Location, Distance ) WITH ( FILLFACTOR = 99 );
Just run that command once after you create the table. From then on, before each new load, you can just TRUNCATE the table and reload it:
TRUNCATE TABLE dbo.table_name
INSERT INTO dbo.table_name WITH (TABLOCK)
SELECT A,B,C,D,E,J,M,N,P,S
FROM dbo.original_table
FRO
ASKER
the 'original_table at bottom of your comment is that the monthly csv file ?
Hi again Ian,
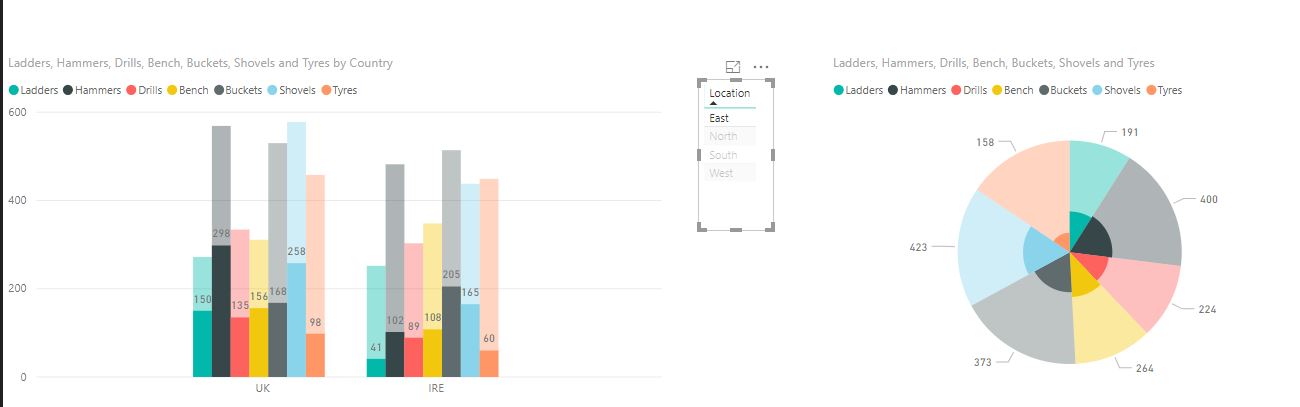
5 Minutes with your sample "Monthly CSV file" in Power BI.
Just quick visuals.
I picked your fields you were interested in, IE shovels, Bench, Hammers etc.
Put a filter in there from location, North, South, East and West.
Filtered in this instance on East
Of we look at Hammers.
Pie graph, total we sold is the black wedge, the East portion (from the pie graph is 400)
The bar graph shows 298 in the UK and 102 in Ireland.... 400 total.
Easy.
Enhancing this would be to add new monthly data to get the longitudinal view over time.
Cheers
Tony
ASKER
Tony, I see that is a way to display visually. I wanted to produce a set of coefficients from regression on the variables as per sample sheet.
ASKER
late here I need zzz's and will tackle this tomorrow thanks
Hi Ian,
Yip OK, I think my original plan is what would work best for you.
1. Put the monthly file into SQL as per normal
2. Create 16 views (which we can repeat each month) of that data as per your specific criteria (I wrote the first one in my original post)
3. Call that view up in Excel (which maybe exceeds your skill) or just run the view in SQL, Cut the data, paste into Excel....repeat 16 times.
That will get you to what you are doing now, although I am not sure of how you are currently extracting the separate data from the monthly data for the 16 extracts?
Cheers
Tony
ASKER
Morning Tony, I was extracting the 16 files from the 'Everything' file by way of a SELECT command and nominating the required columns
as per example below.
SELECT Meeting, Time, RaceType, Furlongs, [Actual Runners]
INTO UFHSS
FROM EVERYTHING
WHERE CAST(RACETYPE as NVARCHAR(50))='Flat'
and cast(furlongs as float) between 0 and 8.1
and cast([Actual Runners] as float) < 10
However the problem is I would have to do that 16 times each month. I don't mind but if there was a better way I'd adopt it.
Are you suggesting calling the View up via Excel is better ? If so I can certainly find out how to do it. My skills in Excel are rather better than my SQL skills.
ASKER
Tony, I understand the above method. Seems straight forward enough.
One question I have is to do with column order. The column order from the original source csv file
is all over the place eg. date in the middle of the pack etc.
I need to sort it at some stage and thought perhaps the best way is from the source into the 'everything' file.
Is this the best way ?
Thanks
Ian
ASKER CERTIFIED SOLUTION
membership
This solution is only available to members.
To access this solution, you must be a member of Experts Exchange.
ASKER
Hi Tony,
Thanks again for your detailed response.
I'll address a few of your points below.
* To avoid misspelt field names I was planning to copy them from the source file headings.
* The column order of the source file I've been assured will not change and if a new column is added then goes at RH end. Hence the date
column being in the middle (which was the RH end at the time). Must have been an afterthought. Bad planning at the start.
* How I get my data into the 'everything' file ? I use the import data function in SQL to import the 5 category files as flat files. Then your 'view
approach would be implemented.
I used the hardware approach as the headings were simple. The horse racing ones such as 'KouldsScore_Distance20pc_
There are about 96 of them and my idea was to copy and paste from the source headings as explained in previous post so as not to cause any misspellings.
I'm guessing to place the columns in the right order I need to sort them first in the 'everything' file and not sure how to do that but will try and find a way. Then use the same import order for the monthly files into SQL. Then after that I'll report back so we can go to next stage of getting data back into Excel.
If I have left anything out please shout.
Cheers and thanks again
Ian
ps..... below is a sample of the query I was planning to use to copy to the 16 files. I would have copied the required fields but have decided to select all. The query also selects criteria and changes column format. 'UFHSS' being one of the 16 file names. Flat Handicap Sprint Small field.
SELECT Meeting, Time, RaceType, Furlongs, [Actual Runners]
INTO UFHSS
FROM EVERYTHING
WHERE CAST(RACETYPE as NVARCHAR(50))='Flat'
and cast(furlongs as float) between 0 and 8.1
and cast([Actual Runners] as float) < 10
Hi Ian,
It's good you are using the data import routines in SQL manually, (automation of SSIS packages adds a lot of layers of complexity), it will allow you to know if your field order has changed in the new files but in fact won't matter because you can manually connect any field if it doesn't join automatically. I imagine you see very horizontal lines at present in your connections from source to destination.
As an asside the import tool creates an SSIS package, which I use as the basis of my automated import routines.
Ah, OK I see you were creating 16 tables from your everything table... the views will do this "on demand" when you call a view rather than having all the tables taking up disk space.
I'm thinking now of the end game. The reason for the data collection. Are we comparing only variations within the month? or are you thinking about comparing the same view month by month?
Cheers
Tony
PS. Remember, first rule of gambling...."gotta bet big, to win big" :-)
ASKER
Hi Tony,
So, to summarise,
* Import all 5 category csv files into SQL and store in one big file 'everything'
* In SQL make 16 views and arrange columns in required order.
* In Excel call a view when required.
I believe this was recommended rather than saving 16 files on SQL
How I use the data ? I plan to use 6 years of data to run the regressions.
I won't be comparing variables month by month or within the month.
I simply just want to build a database on SQL and keep it up to date
whether monthly or three monthly.
When I want to run a regression on the selected data (view) I need to add formulas on the worksheet
and run the regressions and save the file as an xlsx.
Have I missed anything ? Am I understanding correctly ?
aah ! Please explain your claim to update the 5 monthly csv files with a 'press of a button'
Many thanks
Ian
ps........ My experience in gambling tells me......"gotta bet small, to stay in the game" :-)
Sorry, I didn't grasp the qty of 5 monthly source csv files. It is doable, but perhaps stick with manual input each time at the moment and for the time spent 5 times a quarter/month, manual is still the way to go.
Otherwise, I think that is all good. Having the 6 years worth of data in SQL is the perfect home for it....Back the DB up though!!
Pull your data from the source table when you want to do regressions...great.
I know you're into Excel more than SQL so using Excel will be better, however, you can do nearly all Excel functions in SQL...just learn another syntax around it...but you should stick to you what you know is the best cost/benefit of your time.
Have fun
Cheers
Tony
ASKER
Scott, Your Truncate and Clustered options sound interesting and will try and grasp that over the coming weeks. I'm sure we'll be discussing it in the near future as I trundle my way along beginners walk :)
Tony, I find the 'View' method very interesting and as you say, no need to clutter space with too many tables. I am working my way through the 95+ columns trying to correct all the invalid column errors as I copy and past my required columns to the View query.
A BIG Thank You to both you guys as you've been extremely helpful and I have learned a lot about SQL this past week. Now I need to put it into practise.
Thank you Ian, cheers, T
The many ways to handle this, import the whole lot, like you are doing. One way is to then write views using SQL select queries, to look at each of your specific columns and "location" criteria.
Think of a view as per your 16 divided files...
So the first one will be
SELECT Date, Country, Location, Distance, Drills, Bench, Buckets, Shovels, Tyres
FROM YourBigOrignalTable
WHERE Country = 'UK'
AND Location = 'North'
AND Distance <60
If you make this a view, it'll always be able to be executed the same each time, you can view on screen, or export to Excel.....
Or more preferable, use as a dataset in SQL to compare to whatever you would be in your "RUN REGRESSIONS" routines.
Leading on from that
Personally, if you are wanting some quick and easy fancy reporting, put your YourBigOrignalTable into Power BI. The app will let you sort on any of the Categories like you have specified in your 16 separate queries. If YourBigOrignalTable includes several months, then Power BI will let you group by month, therefore compare results over time. Which is what I understand as your RUN REGRESSIONS.
I hope that helps a bit, not muddying the water too much.
Cheers
Tony