BIG problem with upgrade from SQL Server 2014 physical to 2016 VM
We upgraded a physical sql server from SQL Server 2014 to a 2016 VM. There were a lot of changes made outside of just the SQL Server upgrade: OS, Application, SQL Server edition, changed to VM, to name a few.
It is v2016 sp2 CU8. It was Standard Edition before, and still is now. The server is maxed at 128GB ram for max server memory (mb).
From the point of go-live on the new server, ALL performance has been dreadfully slow. 20-30 times slower response than we saw on the old server, for the calls that complete. A lot of them are also timing out. Basically, it is unusable for production requirements.
I have checked everything -- the disk, the cpu, the memory usage -- I did a blitz and blitzfirst check, trying to find what is dragging the server --- absolutely none of my checks are coming back with anything questionable. I don't see any memory or cpu pressure, I don't see anything but expected read and write latencies on the disk and tempdb. I cannot find anything at the sql server to explain this remarkable performance degradation.
I believe it could be the VM, but I do not know how to confirm the VM configuration is good or lacking.
I also fear it could be something new in SQL Server 2016 that I am unaware of -- but, I've performed the 2014 to 2016 upgrade before, and never seen anything like this.
Any Expert help? A script I can run to point to something as the cause of this problem? Ok, I know that is too easy, but I need some insight. Any ideas? This is very urgent.
2 Notes:
1. I have used sp_WhoIsActive and we're seeing much more locking/blocking than expected, certainly more than was occuring on the old server. Is there something with 2016 that would open the door for more locking?
2. The ONLY things that I do see in the log are the two items below. The infinite recompile say 10-12 times, possibly more, and I find the same objects repeatedly in the sqlhandle. I question this, as I have not seen it before, but I doubt it is the main problem, as it is not happening at all times. It does not occur on the old server, so I wonder whether this may be a new 'feature' in the 2016 error/information handling. The 2nd one happens only at startup.
Message
A possible infinite recompile was detected for SQLHANDLE 0x030007003509380099931501
PlanHandle 0x050007003509380070FE9905
recompile reason was 2.
Message
Unsafe assembly 'microsoft.sqlserver.integ
appdomain 2 (SSISDB.dbo[runtime].1).
Agreed, and definitely check the disk subsystem as well: channels, paths, etc..
Also, make sure the statistics on all tables were updated (if you can afford it, use FULLSCAN on all the larger tables). When going from 2014 to 2016, that really shouldn't be an issue, but, based on what you're seeing, I'd update the stats just to be sure.
Also, make sure the statistics on all tables were updated (if you can afford it, use FULLSCAN on all the larger tables). When going from 2014 to 2016, that really shouldn't be an issue, but, based on what you're seeing, I'd update the stats just to be sure.
ASKER
The server is actively in use right now -- attempting to be used, I should say - with production activity. CPU seems to be pegging intermittently. The old server is offline. Current business activity is at its knees. Is there anything you can suggest that I can look at NOW to get closer to the cause? I have not done winrar/7zip benching before. That will take a little more time given the learning curve.
ASKER
>>Also, make sure the statistics on all tables were updated (if you can afford it, use FULLSCAN on all the larger tables). When going from 2014 to 2016, that really shouldn't be an issue, but, based on what you're seeing, I'd update the stats just to be sure.
Yes, I thought of that yesterday, and updated stats on everything last night. 50-60% of the tables were done at FULLSCAN, the rest of them were done at 10% sample. But the same problems persist today. No visible impact.
Yes, I thought of that yesterday, and updated stats on everything last night. 50-60% of the tables were done at FULLSCAN, the rest of them were done at 10% sample. But the same problems persist today. No visible impact.
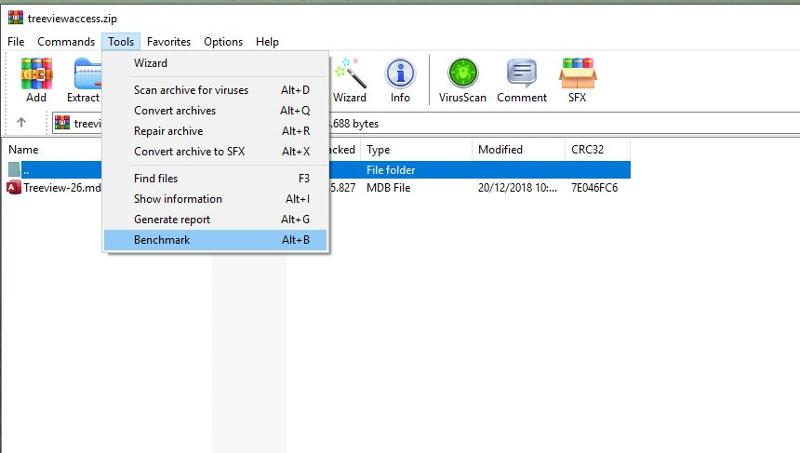
Winrar benchmark doesn't need learning curve...just install WInrar and run it from Tools --> Benchmark...(make sure that MultiThreading is checked - is default) and write down the result...after letting it run for a few seconds

ASKER
Thank you, John. I will look into that in the future as I am sure that would be very helpful -- when I can do it on both systems. That is not an option at this time. It is very obvious the new server is struggling -- but it is not clear at all where the cause(s) is/are. Do you have any other suggestions?
Then definitely check the disk subsystem for I/O speed. Less likely is a run-away Windows or other task over-consuming CPU.
Unless ... does the entire server have only 128GB? If so, you should definitely limit SQL ("max memory") to significantly less than that, say 96GB to start out. Otherwise you will get into memory thrashing, and that could thoroughly trash your performance.
Unless ... does the entire server have only 128GB? If so, you should definitely limit SQL ("max memory") to significantly less than that, say 96GB to start out. Otherwise you will get into memory thrashing, and that could thoroughly trash your performance.
ASKER
Is anyone able to tell me how / where / what to look at in the VM configuration to see if the problem is there? Possibly over-commital of cpu or ram? I am just guessing, but again, the most notable change in my opinion is that we went from physical to VM. I want to see if that is where the problem is.
I am pretty sure that there is a ton of material on the Internet about SQL tuning but unless we have a solid background that the VM is correctly configured to provide maximum output and that is actually hosted on a powerful host that is "better" than the old ..its almost pointless..
I am pretty sure the Virtualization experts will come for help but unless you provide as much as you can more info we will only be guessing.
I am pretty sure the Virtualization experts will come for help but unless you provide as much as you can more info we will only be guessing.
ASKER
>>Unless ... does the entire server have only 128GB? If so, you should definitely limit SQL ("max memory") to significantly less than that, say 96GB to start out. Otherwise you will get into memory thrashing, and that could thoroughly trash your performance.
No. The server has 224GB physical, and I've given 128GB to the engine (because it is Standard).
No. The server has 224GB physical, and I've given 128GB to the engine (because it is Standard).
ASKER
>>but unless we have a solid background that the VM is correctly configured to provide maximum output and that is actually hosted on a powerful host that is "better" than the old ..its almost pointless..
Completely understood, but as I said, "I believe it could be the VM, but I do not know how to confirm the VM configuration is good or lacking."
I have reached out to for the VM savvy person on the server team, but have not heard back yet. Are you able to tell me what to look at?
Completely understood, but as I said, "I believe it could be the VM, but I do not know how to confirm the VM configuration is good or lacking."
I have reached out to for the VM savvy person on the server team, but have not heard back yet. Are you able to tell me what to look at?
I don't see any memory or cpu pressure, I don't see anything but expected read and write latencies on the disk and tempdb
That is odd.
The only other thing, besides I/O issues, that I can think of offhand that might have that big an impact is virus monitoring software (including Windows Defender). But that should show up in cpu use if nothing else.
As i said on my very 1st post...give the specs..
ASKER
SQL Server v2016 sp2 CU8 Standard Edition 64x
Logical processors: 16. Physical memory: 224GB. 128GB given to sql server
Node: 0 State: ONLINE Online schedulers: 8 Offline schedulers: 0 Processor Group: 0 Memory node: 0 Memory VAS Reserved GB: 221
Node: 1 State: ONLINE Online schedulers: 8 Offline schedulers: 0 Processor Group: 0 Memory node: 0 Memory VAS Reserved GB: 221
Your server has 2.59GHz CPUs, and is in high performance power mode
Virtual Server Type: (HYPERVISOR)
This is what I am told regarding the VM config: ' the VMs were all spun up from a basic Windows server 2016 template '
Ample disk, and separate volumes were assigned to the data, log, and tempdb.
Please tell me what more do you need?
ASKER
>>I don't see any memory or cpu pressure, I don't see anything but expected read and write latencies on the disk and tempdb
I must retract. I am seeing cpu pressure. The query below returns 31.92% for signal waits and 68.08% for resource waits. About an hour ago it was twice that on both counts. It is fluctating, but seems to stay fairly mid to high.
SELECT CAST(100.0 * SUM(signal_wait_time_ms) / SUM(wait_time_ms)
AS NUMERIC(20,2)) AS [%signal (cpu) waits] ,
CAST(100.0 * SUM(wait_time_ms - signal_wait_time_ms)/ SUM(wait_time_ms) AS NUMERIC(20, 2))
AS [%resource waits]FROM sys.dm_os_wait_stats ;
Is this VMware of Hyper-V ?
What is the underlying storage system ? RAID type, Disk Type, SSD, SATA, SAS, 15k, 10k, 7k disks ?
You may find that virtualisation of this SQL server is not appropriate, we've migrate from VMs back to physical for SQL, and the performance of the VM is worse than your older physical server! We've seen this many times with SQL....
I wrote about it here...and that was 8 years ago, and not much has changed....
Video - Poor Microsoft SQL Performance caused by Virtualisation - Not all servers are equal!
http://andysworld.org.uk/2011/06/26/poor-microsoft-sql-performance-caused-by-virtualisation-not-all-servers-are-equal/
Just a single CPU host, what is the made and model of server ?
ASKER
Hello Andrew. Some of that I said above, but I will check for specifics on the drives.
SQL Server v2016 sp2 CU8 Standard Edition 64x
Logical processors: 16. Physical memory: 224GB. 128GB given to sql server
Node: 0 State: ONLINE Online schedulers: 8 Offline schedulers: 0 Processor Group: 0 Memory node: 0 Memory VAS Reserved GB: 221
Node: 1 State: ONLINE Online schedulers: 8 Offline schedulers: 0 Processor Group: 0 Memory node: 0 Memory VAS Reserved GB: 221
Your server has 2.59GHz CPUs, and is in high performance power mode
Virtual Server Type: (HYPERVISOR)
I'm afraid it does not tell me which Hypervisor - VMware vSphere or Microsoft Hyper-V, and also make and model of Server, or specification.
So is this a single server, single CPU 2.59GHz Hypervisor, and 224GB memory ?
Not enough information, I'm afraid.
If this is Hyper-V, my "very special friend Philip Elder" here at EE, has written some great documents about Hyper-V Sizing...it might help to give them a read...on the sort of specification require to virtualise VMs.
Some Hyper-V Hardware and Software Best Practices
Practical Hyper-V Performance Expectations
Also maybe try:
SELECT * FROM sys.dm_os_sys_info
Although my 2012 VM just shows "HYPERVISOR", it does not say which one.
SELECT * FROM sys.dm_os_sys_info
Although my 2012 VM just shows "HYPERVISOR", it does not say which one.
ASKER
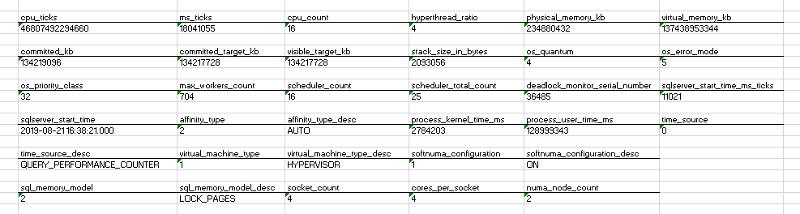
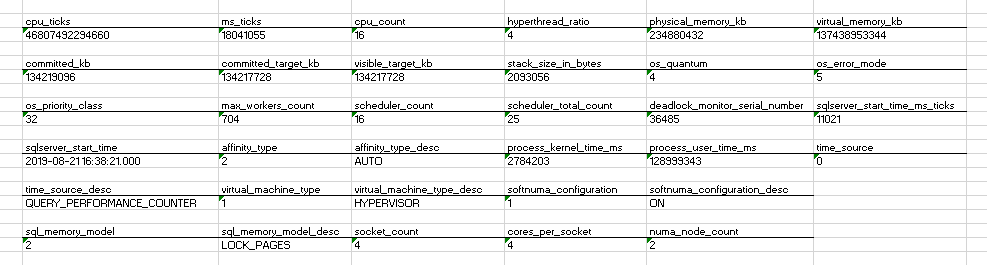
Thanks, Scott. Unfortunately, mine just says 'HYPERVISOR' as well. I have screenshotted the data from sys.dm_os_sys_info below, and I have reached out for more specific details regarding disk and specifics on the hypervisor.
>>So is this a single server, single CPU 2.59GHz Hypervisor, and 224GB memory ?
Yes. That is correct, Andrew.
The performance degradation is dramatic. For this reason, I feel as though it could be something very specific w/the VM, or possibly even with SQL Server 2016 configuration -- but again, I am not finding it. I have seen notable performance problems before with physical to VM sql server migration -- in one case, the VM was rebuilt and the problem magically resolved, in one case the cpu/memory was overcommitted at the VM. When corrected, the problem subsided. Of course, I don't know if it is the same type of problem, and that is why I've opened this inquiry.
Single CPU is not good, though. SQL is a CPU hog. Besides which, you're paying for 4 cores regardless, since that is the minimum number, IF I understand licensing correctly (although I am NOT at all an expert on licensing issues).
Hmm, your output above shows 4 CPUs with 4 cores each, but, since it's VM, they could be split up. Do you know how many core licenses you have?
Hmm, your output above shows 4 CPUs with 4 cores each, but, since it's VM, they could be split up. Do you know how many core licenses you have?
ASKER
>>So is this a single server, single CPU 2.59GHz Hypervisor, and 224GB memory ?
Yes. That is correct, Andrew.
Correction. It is not a single cpu, as per the output from my sys.dm_os_sys_info above. Thank you, Scott, for the correction. I do not know how many core licenses they have. What is the fastest way to find that data?
Yes. That is correct, Andrew.
Correction. It is not a single cpu, as per the output from my sys.dm_os_sys_info above. Thank you, Scott, for the correction. I do not know how many core licenses they have. What is the fastest way to find that data?
That depends on your specific shop, who keeps the license info there. If you went thru a 3rd party (re)seller, they could tell you.
We'll assume you have all cores available to you. 16 cores should be plenty of CPU for even reasonably heavy activity.
We'll assume you have all cores available to you. 16 cores should be plenty of CPU for even reasonably heavy activity.
ms_ticks from sys.dm_os_sys_info shows the SQL Server is doing almost nothing...
What shows the Activity Monitor in SSMS? You should focus on Resource Waits and then at Data File I/O. What Wait category has the highest values?
What shows the Activity Monitor in SSMS? You should focus on Resource Waits and then at Data File I/O. What Wait category has the highest values?
ASKER
Thank you, pcelba. If it is doing almost nothing, what do you think about the cpu spikes that seem to be occurring? Running the query below, I am seeing resource waits as high as 80%. It is not constant, but they are definitely spiking. Your thoughts?
SELECT CAST(100.0 * SUM(signal_wait_time_ms) / SUM(wait_time_ms)
AS NUMERIC(20,2)) AS [%signal (cpu) waits] ,
CAST(100.0 * SUM(wait_time_ms - signal_wait_time_ms)/ SUM(wait_time_ms) AS NUMERIC(20, 2))
AS [%resource waits]FROM sys.dm_os_wait_stats ;
SELECT CAST(100.0 * SUM(signal_wait_time_ms) / SUM(wait_time_ms)
AS NUMERIC(20,2)) AS [%signal (cpu) waits] ,
CAST(100.0 * SUM(wait_time_ms - signal_wait_time_ms)/ SUM(wait_time_ms) AS NUMERIC(20, 2))
AS [%resource waits]FROM sys.dm_os_wait_stats ;
With specs usually we mean:
Vendor / Model/ CPU / HDD/Memory/OS /Hypervisor
All these detailed with version/level..with all the background info...for example HDD controller...does it has battery...how many MBs memory...what firmware...what HDDs...
A small example...i had a very old VMware host...everything was running slow...so i tried to optimize it...step 1...turn off monitoring..dramatic performance increase...better balance CPU/memory...another performance increase
In all cases you need to know what performance you "have" and what you have "gained"...e.g. when you have 1500 in WInRar benchmark and you change something and you jump to 1800 you know you are on the right track...
Another example ..why details are needed...IF for example your infrastructure is based on a SAN ...then no matter what make was the Old server the new server would have exactly the same performance when it comes to HDD subsystem...and it gets even more complex when for example you have Vmware where you need to tweak the IO susbystem to make the most...
what was the WinRAR benchmark ?
see also here
https://www.mssqltips.com/sqlservertip/4801/sql-server-does-not-use-all-assigned-cpus-on-vm/
see also here
https://www.mssqltips.com/sqlservertip/4801/sql-server-does-not-use-all-assigned-cpus-on-vm/
@Andrew is a super simplified Benchmark that gives a simple overview of a machine in terms of performance....just compare two machines ...the newer will normally outperform the older...there are quite some factors that affect (CPU/Memory/HDD) but especially for VMs is my 1st stop to see if a change has positive of negative effect.
ASKER
>>Benchmark that gives a simple overview of a machine in terms of performance....just compare two machines ...
As I said, the benchmark is not an option at this point. The old server is unavailable.
It is VMWare.
The SAN is a 3Par 8400 4 Node Solution. Storage is a mixture of SSD and SAS drives, with fiber channel backend to 2 brocade switches. The SAN has 16G ports X 8 connected to the brocade switches that are embedded into the blade system (4 fiber connections per brocade switch). 128G throughput to the blade system enclosure total.
Blade System Enclosure: Synergy 12000 CTO Frame
Blades: HPE SY480 Gen10 Xeon Gold 6142 (2 Proc) with 512G and 300G Raid1 local boot drives for the Hypervisor. Dual 16G HBA to Storage (32G possible). Dual 20G Network Adapters (40G possible).
RAID: The VMDK files for the VM are running on a VMWare VMFS6 LUN. The LUN is RAID6.
NOTES:
1. We can convert the LUN to RAID1, but we did not see anything specifically pointing to disk as the problem point.
2. The database in question is only on SSD in the SAN.
Thanks for the feedback.
To be honest with you I don't really care about the old server, Winrar benchmarks, but a figure for the new server should be good, but your SAN and Host should provide good disk I/O.
Okay.....so now we need to understand how the VM is configured as to CPU/Cores, and also ESXi version.
It makes a different if the version is 5.5/6.0 o 6.5/6.7, as to cores and sockets configuration, and if too many have been allocated.
If you have a TOTAL of 16 Cores in the Physical Host CPU (e.g. 32 for Dual Processors), when sizing for VMs, for performance you should not allocate more than 32 vCPU for all your VMs on this server. For sizing purposes to rule out contention and performance issues, when and only when.... you have spare capacity you can add more VMs, or add more vCPU to VMs.
At present you've allocated half to this single VM, e.g. 16, so how many other Cores are used by VMs, this may need to be escalated to your vSphere Admins, to look at the entire host.
If 16 ore more have been allocated to other VMs, CPU maybe constrained!
Now the SQL Bible for VMware vSphere is the following:- Setup your VM as follows....
ARCHITECTING MICROSOFT SQL SERVER ON VMWARE vSPHERE® Best Practices Guide
ASKER
Thank you for the input and the bible. Though I did already have that, and had forwarded it to the appropriate people when the VM was first being setup. The problem persists today. I am still analyzing and trying to find the point of contention.
Also, I am told that they've only allocated 18, or 32 cores to VMs on that host.
Also, I am told that they've only allocated 18, or 32 cores to VMs on that host.
Well a lot of things might have effect so : HPE 3PAR StoreServ Storage and VMware vSphere 6.5 best practices and HPE Reference Configuration for Microsoft SQL Server 2016
@dbaSQL We already know the CPU is OK, the RAM is OK so we should focus on the disk. Your query
SELECT CAST(100.0 * SUM(signal_wait_time_ms) / SUM(wait_time_ms)
AS NUMERIC(20,2)) AS [%signal (cpu) waits] ,
CAST(100.0 * SUM(wait_time_ms - signal_wait_time_ms)/ SUM(wait_time_ms) AS NUMERIC(20, 2))
AS [%resource waits]FROM sys.dm_os_wait_stats ;
does not distinguish between single resources which could tell more. Your query shows just the overall ratio between signal waits and total waits and values 20 / 80 are close to the common average. You may read here what the Signal waits value represent.
To analyse waits in more details please post the result from following queries:
SELECT * FROM sys.dm_os_wait_stats ORDER BY wait_time_ms DESC
and also
SELECT * FROM sys.dm_os_wait_stats ORDER BY signal_wait_time_ms DESC
The TOP x rows should be sufficient.
Easier is to look at Resource Monitor. It is available on Performance tab in Windows Task Manager.
Disk Queue length in Resource Monitor shows the overall disk load, you may also look what application causes the high Disk load.
Resource Monitor shows also CPU usage which we expect is not high. (RAM can be used at almost 100% by SQL Server which is obvious.)
ASKER
Thank you for that additional input, pcelba. Definitely appreciated.
There have been zero changes made at the SQL Server or databases since this post, yet the problem has subsided as of late Friday and today. I cannot say it is fixed because I still don't have a clear picture of what the problem was -- but, the application performance is now acceptable again. I know that sounds pretty bad, but that's all I've got right now. Thank you all for your input.
There have been zero changes made at the SQL Server or databases since this post, yet the problem has subsided as of late Friday and today. I cannot say it is fixed because I still don't have a clear picture of what the problem was -- but, the application performance is now acceptable again. I know that sounds pretty bad, but that's all I've got right now. Thank you all for your input.
ASKER CERTIFIED SOLUTION
membership
This solution is only available to members.
To access this solution, you must be a member of Experts Exchange.
Then the absolute simplistic check...just run a benchmark...just to see if the VM is really on its knees compared to the old server...for me the very first ...almost naive test is to run winrar or 7zip benchmark...nothing fancy...just a little number that shows how fast is one machine compared to another..