Excel VBA: Update graph through a function v3
Hello experts,
I have the following files attached (Yearly-timeline, Daily-timeline)
I would like to add new requirements :
Yearly-timeline:
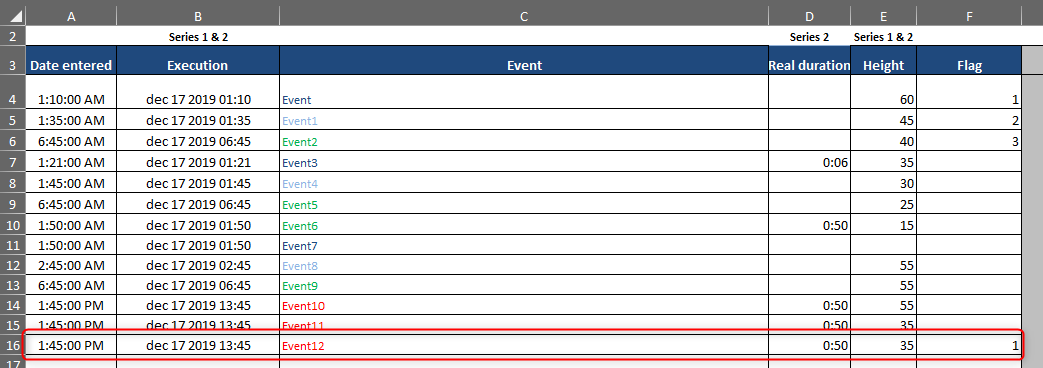
1.Remove column A & B in order to align with Daily-timeline
2.Start graphic display as of row 4 instead of row 6
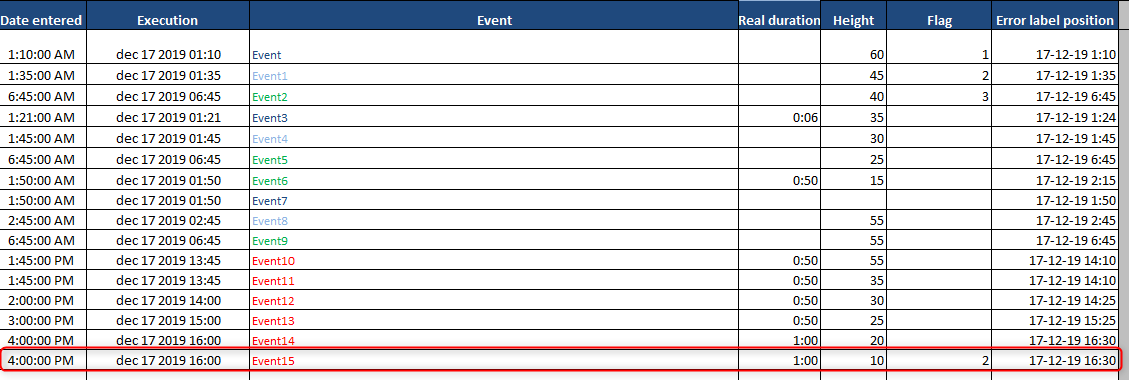
3.Manage data labels title as following:
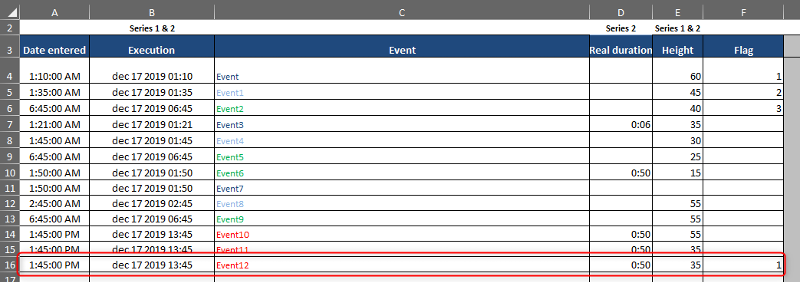
Based on value reported in Column Flag for each entry the display should be as following:
Value = 1: Title + data entered
Value = 2: Title
Value = 3: nothing (no title, no data entered)
Other than 1, 2, 3 Title + data entered
If Flag mechanism cannot be managed by entry, a flag reported next to axis will be manage globally with the same logic.
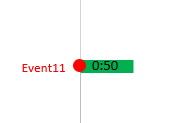
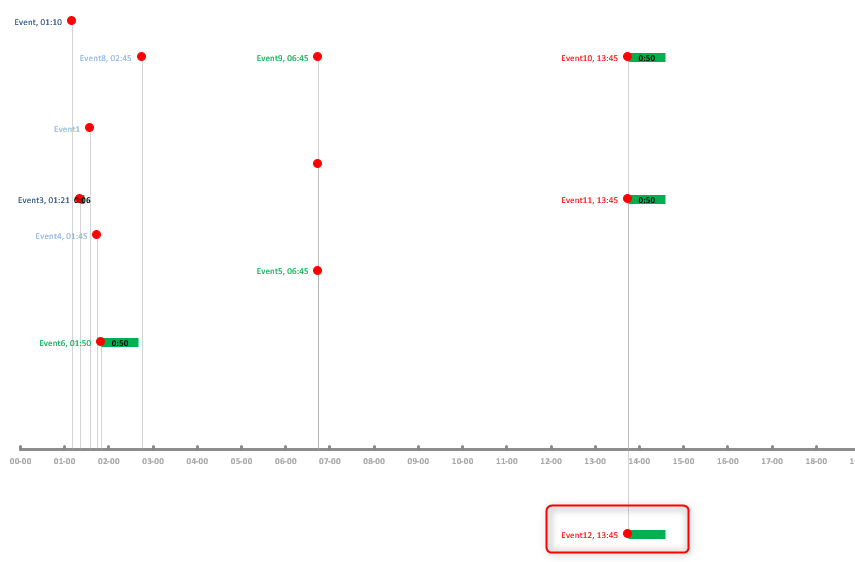
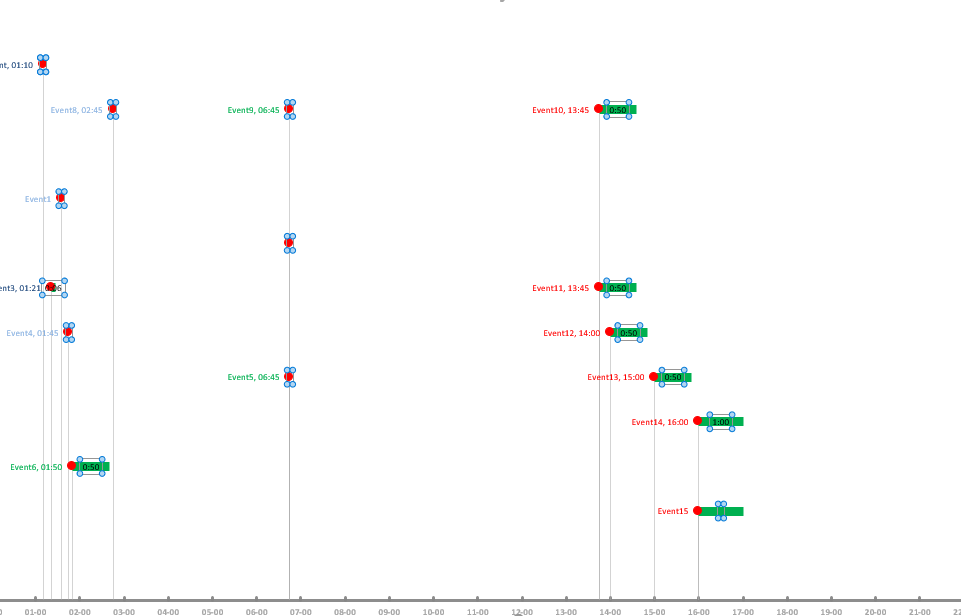
4.Display duration of green bar center alignment. (If possible).
Daily-timeline:
-Requirement 2 & 3 and 4 reported above.
If you have questions, please contact me.
Thank you for your help.
Daily-timeline.xlsm
Yearly-timeline.xlsm
I have the following files attached (Yearly-timeline, Daily-timeline)
I would like to add new requirements :
Yearly-timeline:
1.Remove column A & B in order to align with Daily-timeline
2.Start graphic display as of row 4 instead of row 6
3.Manage data labels title as following:
Based on value reported in Column Flag for each entry the display should be as following:
Value = 1: Title + data entered
Value = 2: Title
Value = 3: nothing (no title, no data entered)
Other than 1, 2, 3 Title + data entered
If Flag mechanism cannot be managed by entry, a flag reported next to axis will be manage globally with the same logic.
4.Display duration of green bar center alignment. (If possible).
Daily-timeline:
-Requirement 2 & 3 and 4 reported above.
If you have questions, please contact me.
Thank you for your help.
Daily-timeline.xlsm
Yearly-timeline.xlsm
ASKER
Thank you very much.
Concerning point 4.
If duration has a value
 It should be displayed centered in the green bar.
 I am searching the option described in format but I cannot find it:
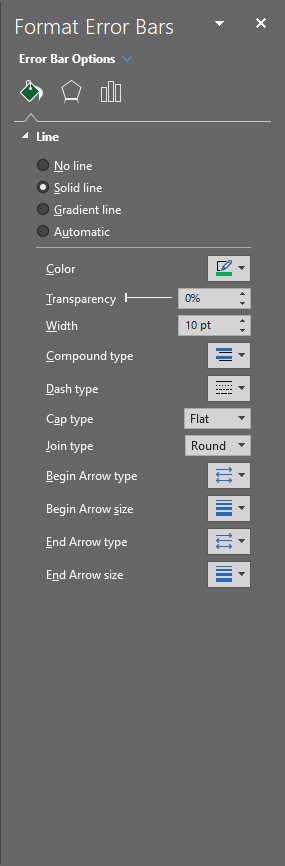 The option described is in which section: line, shadow or horizontal?
Concerning point 4.
If duration has a value
 It should be displayed centered in the green bar.I am searching the option described in format but I cannot find it:The option described is in which section: line, shadow or horizontal?
SOLUTION
membership
This solution is only available to members.
To access this solution, you must be a member of Experts Exchange.
ASKER
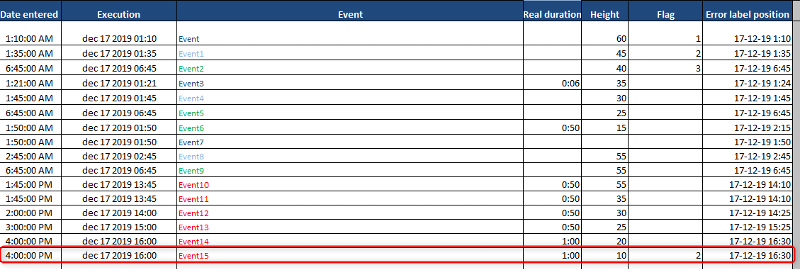
Great! I am just having a problem, I don't know why the new entry doesn't display in the graph even after I run the procedure.
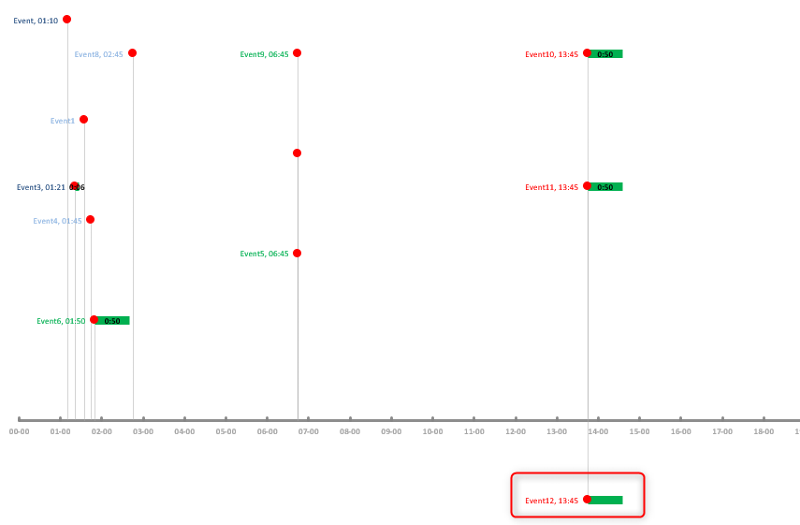 I checked at select data range and it is covered.
In order to include all the attributes related to the graph next to each other, I moved X-Values column next to the Flag column. Could you please help to modify the procedure and if necessary the function?
I think that graph data series shouldn't be modified as I did a cut of X-Values column.
I attached files.
If this requires a lot of modification I will take previous version.
Thank you for your help.
Yearly-timeline-2.xlsm
Daily-timeline-2.xlsm
ASKER CERTIFIED SOLUTION
membership
This solution is only available to members.
To access this solution, you must be a member of Experts Exchange.
ASKER
Thank you.
Strange having the same issue. I don't if this is due to my excel version 2016.
Strange having the same issue. I don't if this is due to my excel version 2016.
ASKER
Ok, I applied the procedure described at:
https://excel.uservoice.co
Thank you very much for your great support!
https://excel.uservoice.co
Thank you very much for your great support!
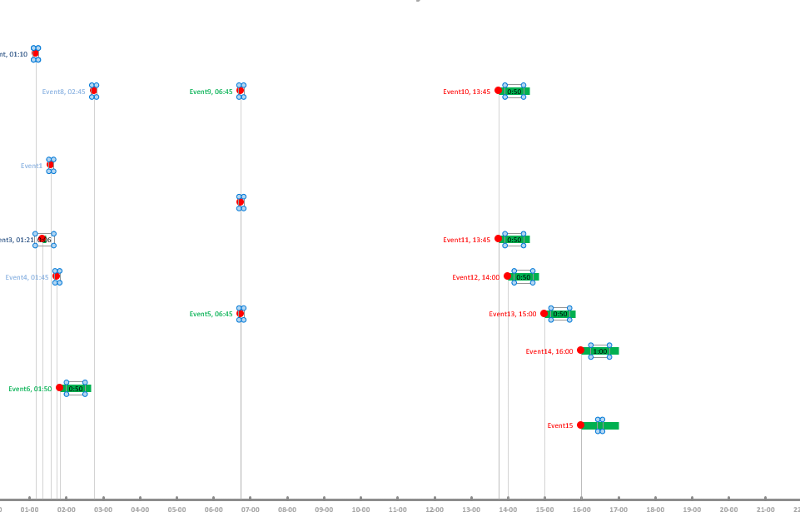
Labels due to the flag column value.
I don't understand point 4.
If the green bars are centered on the dots, then green labels are invisible.
To center, right click on one of the bars, and format to Both.
Daily-timeline.xlsm
Yearly-timeline.xlsm