Power BI Group By Date and Time
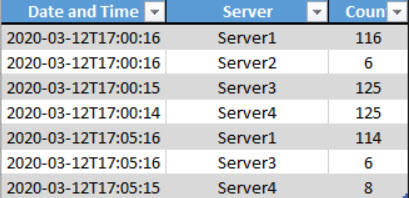
Hello. I have imported data into Power BI. The data consists of a server name, count, and time. The time is broken down into approximately five minute intervals with seconds being included in the time format.
I would like to report on the total per five minute interval for all servers and not just for each individual server. Below is what the data looks like and the desired out. I have tried group by in multiple ways but cannot get it to work properly. Any guidance would be appreciated.
Current Results

Desired Results

I would like to report on the total per five minute interval for all servers and not just for each individual server. Below is what the data looks like and the desired out. I have tried group by in multiple ways but cannot get it to work properly. Any guidance would be appreciated.
Current Results
Desired Results
I don't have BI on my current computer, but I am guessing you could build a date table as a lookup and in that table parse out the seconds in the time/date so that only the five minute intervals would show. Then the pivot table would work on the parsed out time/date.
ASKER
ASKER CERTIFIED SOLUTION
membership
This solution is only available to members.
To access this solution, you must be a member of Experts Exchange.
Try this.
1 Create a column in the original table, let's call it Date (5 mins).
Date (5 Mins) = FLOOR([Date And Time], TIME(0,5,0))
2 Create a new table using this DAX formula for the first column, and name this column 'TimeLine'.
GENERATESERIES(MIN('Table'
3 Add a second column to the new table using this formula.
Count = CALCULATE(SUM('Table'[Coun
Thank you, Lorrec. I hope you got to where you wanted to go. I've gotten a bit distracted on a project, and did not follow up with you as timely as I wished. - Tom