How Can I Better Define Pagination Features Offered in Datatables.js?
I've been asked to edit an existing app by eliminating the "pagination" feature of a third party vendor called "Datatables."
Here's what the page looks like currently:
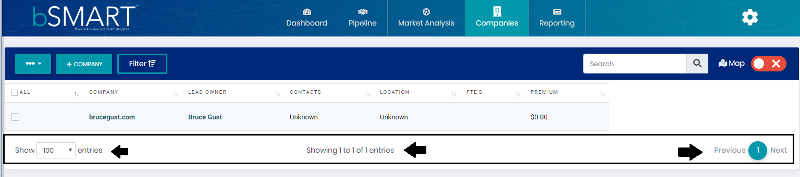
Sweet little package, but the "features" that I have identified with an arrow within the big, black box - those are the guys that I'm needing to eliminate, but only in the event that the number of total rows is 10 or less.
My question is, "How?"
I've read through some documentation, but I'm at a point where I would welcome anyone who's been down this road before to give me some insight.
What do you think?
Thanks!
ASKER
Chris, I believe I'm poised on the threshold of great things!
First off, here's my 'datatables.js" file. Look at lines #64-70. I can identify how many pages I'm getting ready to render...:
Now, couple that with this:
By setting "length" and "paginate" to "visiblility:hidden," I can accomplish what I'm trying to do.
My dilemma is being able to get this:
var $paging_div = $table.find('.dataTables_l
...to work.
I'm creating the table dynamically, so I can't really "see" what's happening by just referring to the source code. So, I'm targeting the "dataTables_paginate" class, but I'm missing it every time.
Do you have any suggestions on how I can better grab on to that class and set its visiblility to "none?"
First off, here's my 'datatables.js" file. Look at lines #64-70. I can identify how many pages I'm getting ready to render...:
var dtParams = {},
dtTables = {},
hasChart = false,
chartIsRendered = false,
ctx, marketChart;
$(document).ready(function(){
if (!$.fn.dataTable) {
return;
}
if ($('#marketChart').length > 0) {
// set the flag
hasChart = true;
// set the global references
ctx = $('.dt-chart');
}
$('table.make-datatable').each(function(i){
// set local defaults
var $table = $(this),
id = $table.attr('id'),
route = $table.attr('data-route'),
layout = $table.attr('data-layout') || 'blfrtip',
columns = getColumnsFromTableHead($table),
callBackFunction=$table.attr('data-callback');
dtTables[id] = $table.DataTable( {
//paging: false,
//pageLength:10,
processing: true,
serverSide: true,
ajax: {
url: route,
type: 'POST',
data: function ( d ) {
if (hasChart) {
dtParams.chartGroupBy = $('#chart-filters-group').val();
}
return $.extend(d, dtParams);
}
},
columns: columns.cols,
/*order: [ // Commented to fix performance issue
[columns.sortBy, 'asc']
],*/
dom: layout,
buttons: [
{ extend: 'copy', className: 'btn-info' },
{ extend: 'csv', className: 'btn-info' },
{ extend: 'excel', className: 'btn-info', title: 'XLS-File' },
{ extend: 'pdf', className: 'btn-info', title: $('title').text() },
{ extend: 'print', className: 'btn-info' }
],
drawCallback: function () {
$('[data-toggle="popover"]').popover();
$('[data-toggle="tooltip"]').tooltip();
if (typeof callBackFunction != 'undefined') {
var api = this.api();
var rows = api.rows({ page: 'current' }).nodes();
var pages = api.page.info().pages;
if(pages==1) {
console.log("booya");
//var $paging_div = $('#main-dt').find('div.dataTables_paginate');
var $paging_div = $table.find('.dataTables_length');
$paging_div.css('visibility', 'hidden');
}
//let rows = $table.rows();
if (rows) {
var ids = [];
$.each(rows, function (index,row) {
ids.push(row.id);
});
if (localStorage.getItem('map_companyIds')===null || localStorage.getItem('map_companyIds') === undefined) {
heatMap.init(ids, 0, (route.indexOf('companies')>0?'companies':'market'));
}
}
}
}
});
//here there's a chance for things to go south in that you can have a "hasChart," but no JSON
if (hasChart) {
dtTables[id].on('xhr.dt', function(e, settings, json, xhr){
if(json) { //this was if(json !== 'undefined'), but it wasn't sufficient in that it could still be NULL which resulted in an error
if (json.chartData) {
console.log("you've got something");
buildChart(json.chartData);
}
}
else {
console.log("your JSON is not happening");
}
});
}
});
function getColumnsFromTableHead($table) {
var columns = [],
sortBy = null;
$table.find('thead th').each(function(i){
var $th = $(this),
key = $th.attr('data-field'),
tmp = {
searchable: (typeof $th.attr('data-searchable') != 'undefined' && $th.attr('data-searchable') == '1') ? true : false,
orderable: (typeof $th.attr('data-sortable') != 'undefined' && $th.attr('data-sortable') == '1') ? true : false
},
funcs = dtFormatFuncs || {};
// set the data key
switch (key) {
case ':checkbox':
tmp.mRender = function(data, type, row) {
return '<div class="pretty p-default">' +
'<input type="checkbox" class="table-cb" value="' + row.DT_RowId + '" data-text="' + escapeHtml(row.name)+'" />' +
'<div class="state p-primary">' +
'<label> </label>' +
'</div>' +
'</div>';
};
break;
case ':actions':
if (typeof funcs._actions != 'undefined') {
tmp.mRender = funcs._actions;
} else {
tmp.mRender = function ( data, type, row ) {
return '<div class="text-right">' +
'<a href="' + fillLinkTemplate('/objects/edit/__DT_RowId__', row) + '" class="btn btn-link"><i class="fal fa-fw fa-pencil fas fa-pencil-alt"></i></a> ' +
'<a href="' + fillLinkTemplate('/objects/delete/__DT_RowId__', row) + '" class="btn btn-link"><i class="fal fa-fw fa-trash"></i></a>' +
'</div>';
};
}
break;
default:
tmp.data = key;
// check for a custom format function
if (typeof funcs[key] != 'undefined') {
tmp.mRender = funcs[key];
}
// add in the default sorting
if (!sortBy) {
sortBy = i;
}
break;
}
// check for a link reference
if (typeof $th.attr('data-link') != 'undefined') {
var link = $th.attr('data-link');
tmp.mRender = function ( data, type, row ) {
return '<a href="' + fillLinkTemplate(link, row) + '">' + row[key] + '</i></a>';
};
}
// add it to the list
columns.push(tmp);
});
return {
cols: columns,
sortBy: sortBy
};
}
function fillLinkTemplate(link, row) {
var placeholders = {},
key = '';
return link.replace(/__(.+?)__/g, function(m){
key = m.replace(/^__/, '').replace(/__$/, '');
if (typeof row[key] == 'undefined') {
row[key] = '';
}
return row[key];
});
}
function buildChart(chartData) {
var type = $('#chart-filters-type').val(),
dataLabel = $('#chart-filters-group > option:selected').text(),
labels = [],
data = [];
for (var i in chartData) {
labels.push(chartData[i]._id);
data.push(chartData[i].total);
}
var opts = {
type: type,
data: {
labels: labels, //["Red", "Blue", "Yellow", "Green", "Purple", "Orange"],
datasets: [{
label: dataLabel,
data: data, // [12, 19, 3, 5, 2, 3],
backgroundColor: '#0062cc',
borderColor: '#005cbf',
borderWidth: 1
}]
}
};
// just update an existing chart
if (chartIsRendered) {
marketChart.destroy();
}
chartIsRendered = true;
marketChart = new Chart(ctx, opts);
}
});Now, couple that with this:
    .dataTables_wrapper .dataTables_length,
    .dataTables_wrapper .dataTables_paginate,
    .dataTables_wrapper .dataTables_filter,
    .dataTables_wrapper .dataTables_info {
        display: inline-block;
		/*visibility:hidden;*/
        width: 33%;
        padding: .75rem 1.25rem;
}By setting "length" and "paginate" to "visiblility:hidden," I can accomplish what I'm trying to do.
My dilemma is being able to get this:
var $paging_div = $table.find('.dataTables_l
...to work.
I'm creating the table dynamically, so I can't really "see" what's happening by just referring to the source code. So, I'm targeting the "dataTables_paginate" class, but I'm missing it every time.
Do you have any suggestions on how I can better grab on to that class and set its visiblility to "none?"
ASKER CERTIFIED SOLUTION
membership
This solution is only available to members.
To access this solution, you must be a member of Experts Exchange.
SOLUTION
membership
This solution is only available to members.
To access this solution, you must be a member of Experts Exchange.
ASKER
   drawCallback: function () {
                $('[data-toggle="popover"]').popover();
                $('[data-toggle="tooltip"]').tooltip();
                if (typeof callBackFunction != 'undefined') {
                    var api = this.api();
                    var rows = api.rows({ page: 'current' }).nodes();
					var pages = api.page.info().pages;
					if(pages==1) {
						//console.log("booya");
						let bench = $('table').closest('.table-responsive');
						let length = bench.find('.dataTables_length');
						let paginate = bench.find('.dataTables_paginate');
						let information = bench.find('.dataTables_info');
						$(length).css('visibility', 'hidden');
						$(paginate).css('visibility', 'hidden');
						$(information).css('visibility', 'hidden');
					}
                    //let rows = $table.rows();
                    if (rows) {
                        var ids = [];
                        $.each(rows, function (index,row) {
                            ids.push(row.id);
                        });
                        if (localStorage.getItem('map_companyIds')===null || localStorage.getItem('map_companyIds') === undefined) {
                        heatMap.init(ids, 0, (route.indexOf('companies')>0?'companies':'market'));
                        }
                    }
                }
}Do you smell that, Chris? That's the aroma of charred dragon flesh!
We slayed the dragon, man!
Thanks!
Good stuff Bruce :)
Not sure whether that useful or not, but it seems to be the only way to go.
As it appears the Pagination is driven by a plug-in (several available by default), you could technically write your own (or at least clone and edit an existing one).