Excel regression x variable (slope) not showing decimal places.
When I run a regression in Excel, the x variable shows up without any decimal places. I can format the cell to show decimals, but when I re-run the regression, it shows no decimals again. I have hundreds of regressions to perform and formatting the x variable after each one is a pain. Is there any way I can set the x variable cell to always return the value to four decimal places?
Martin Liss
Can you supply a sample workbook?
Use the LINEST function for your regression rather than the tool built into Analysis Tool Pack. You can put an array formula with it on a n+1 column by 5 row range of cells to return the coefficients, R squared and other statistics.
You can perform more than one regression by copying the formula down. You can also format those cells as you like.
You can perform more than one regression by copying the formula down. You can also format those cells as you like.
ASKER
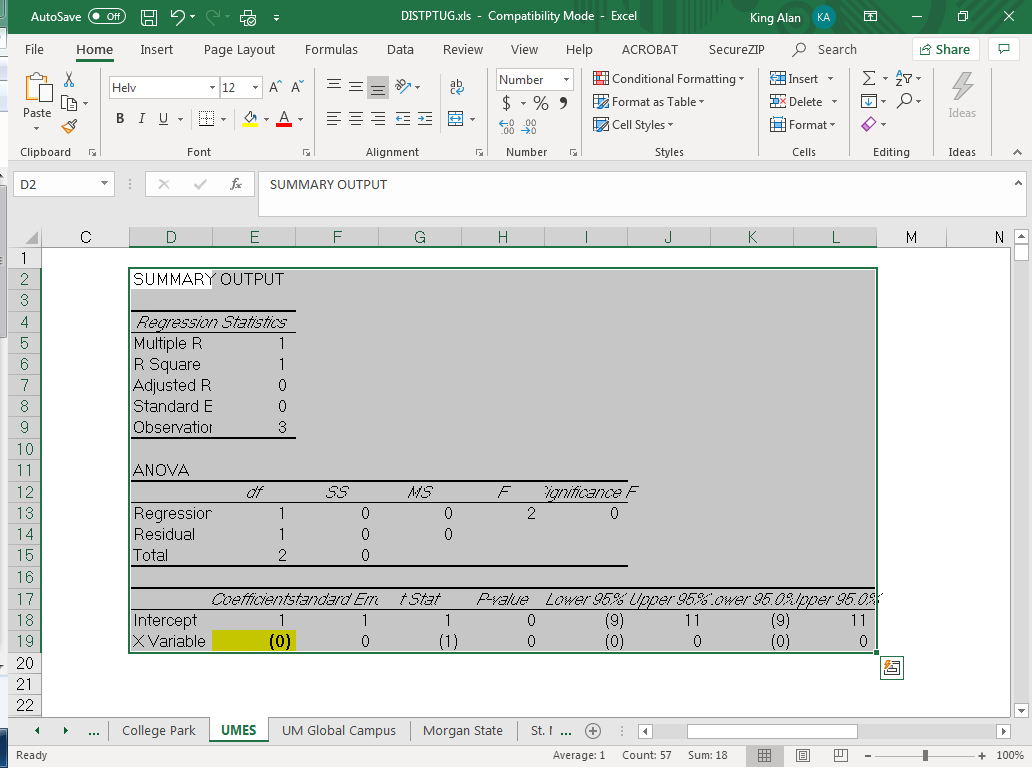
@Martin Liss - Here is a screenshot of the regression output. Notice how the x variable (shown in bold yellow) displays (0). The actual value is 0.00552122134631378 and I would like for it to show 0.0055.
@byundt - This is one small part of a collection of more than 70 workbooks and hundreds of worksheets used for analysis and projections that has been in place for more than 20 years. To no longer user the Analysis Tool Pack would be too monumental of a task to accomplish. The output I have shown in the screen shot above represents one tab of 29 in each of six different workbooks that are used as the source for six more workbooks which are the source for two more workbooks which are the source for two more workbooks which are the source for two more workbooks which are the source for 15 tabs of a final workbook. So you can see what a hopeless task it would be to convert them using LINEST.
@byundt - This is one small part of a collection of more than 70 workbooks and hundreds of worksheets used for analysis and projections that has been in place for more than 20 years. To no longer user the Analysis Tool Pack would be too monumental of a task to accomplish. The output I have shown in the screen shot above represents one tab of 29 in each of six different workbooks that are used as the source for six more workbooks which are the source for two more workbooks which are the source for two more workbooks which are the source for two more workbooks which are the source for 15 tabs of a final workbook. So you can see what a hopeless task it would be to convert them using LINEST.
Here's the beginning of code that you can add to the UMES sheet. Add similar lines of code to format the results anytime anything in the worksheet changes.
Private Sub Worksheet_Change(ByVal Target As Range)

    Range("E13").NumberFormat = "0.0000"
    ' If you want enclosing parentheses do it this way
    ' Range("E13").NumberFormat = "0.0000_);(0.0000)"
End SubASKER CERTIFIED SOLUTION
membership
This solution is only available to members.
To access this solution, you must be a member of Experts Exchange.
Sometimes the workbook display can change depending on the printer that is specified. See if you have a common printer specified, and if not, change it to see if that fixes your issue.
ASKER
I actually found the culprit that was causing part of the problem. Somehow the files advanced options had the Automatically insert a decimal point box checked. I unchecked the box and the value returned correctly but, unfortunately when I re-ran the regression, it still displayed the x variable as a whole number without the decimals.There is apparently no easy way to change the general number format, but your responses were very educating and I appreciate your efforts. Thanks.