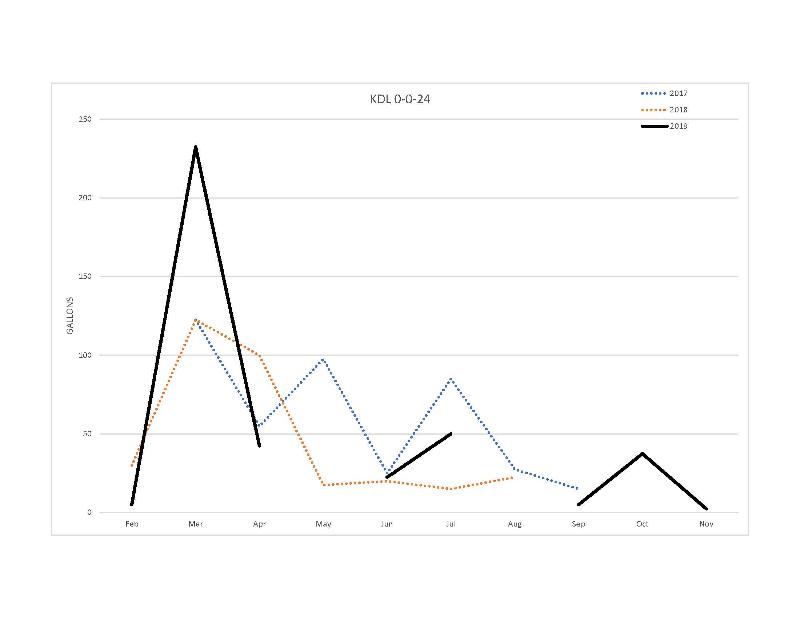
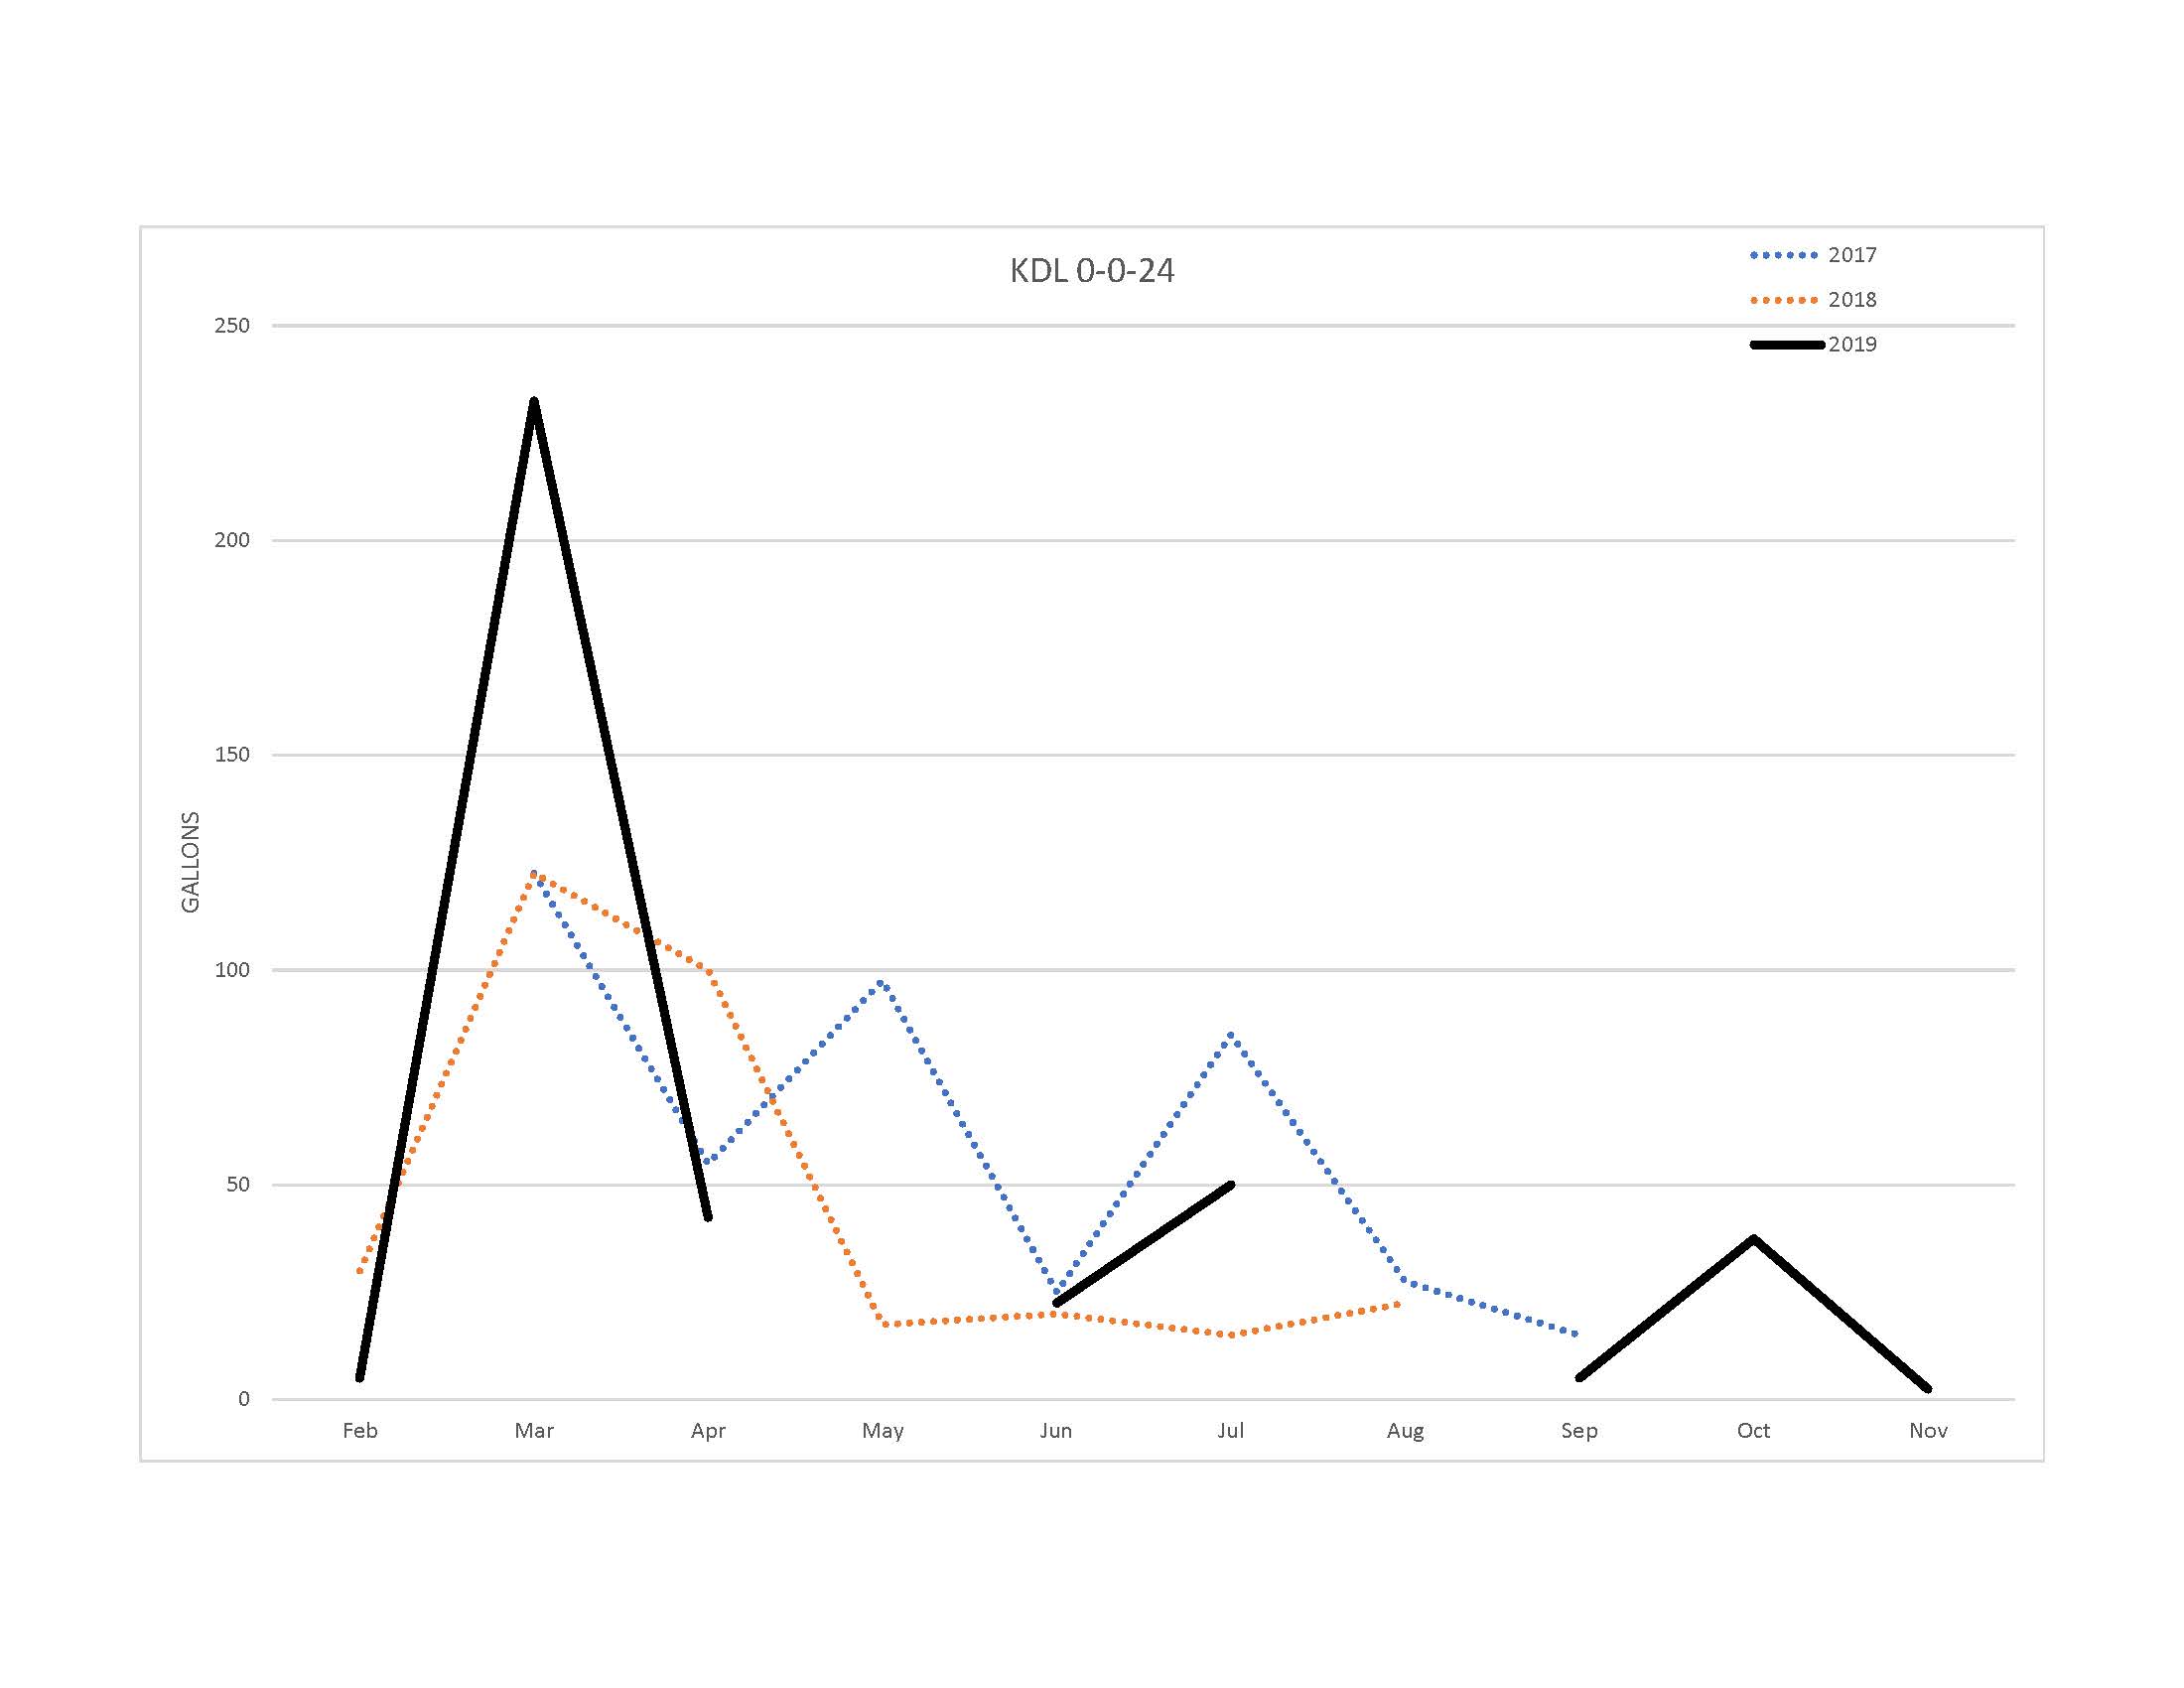
How to show a zero value on pivot chart when no data exists for month on y axis
How do I format a Pivot chart to show all 12 months on the y axis, and use a zero value for that month when no data exists for that month? See the breaks in the attached image to see what's missing. I'd like the chart to show all 12 months on the y axis, and show a zero value for that month if no data exists for that month - show a complete line for the charted data without breaks in it like in the example 2019 line.
ASKER
Solution was 2 part:
1. Created a "Calendar table" from the data file. In power pivot, selected the data file / Design Tab / Create Date Table. Then associated the date fields between the data table and the newly created calendar table. Closed the PowerPivot window and go back to Excel.
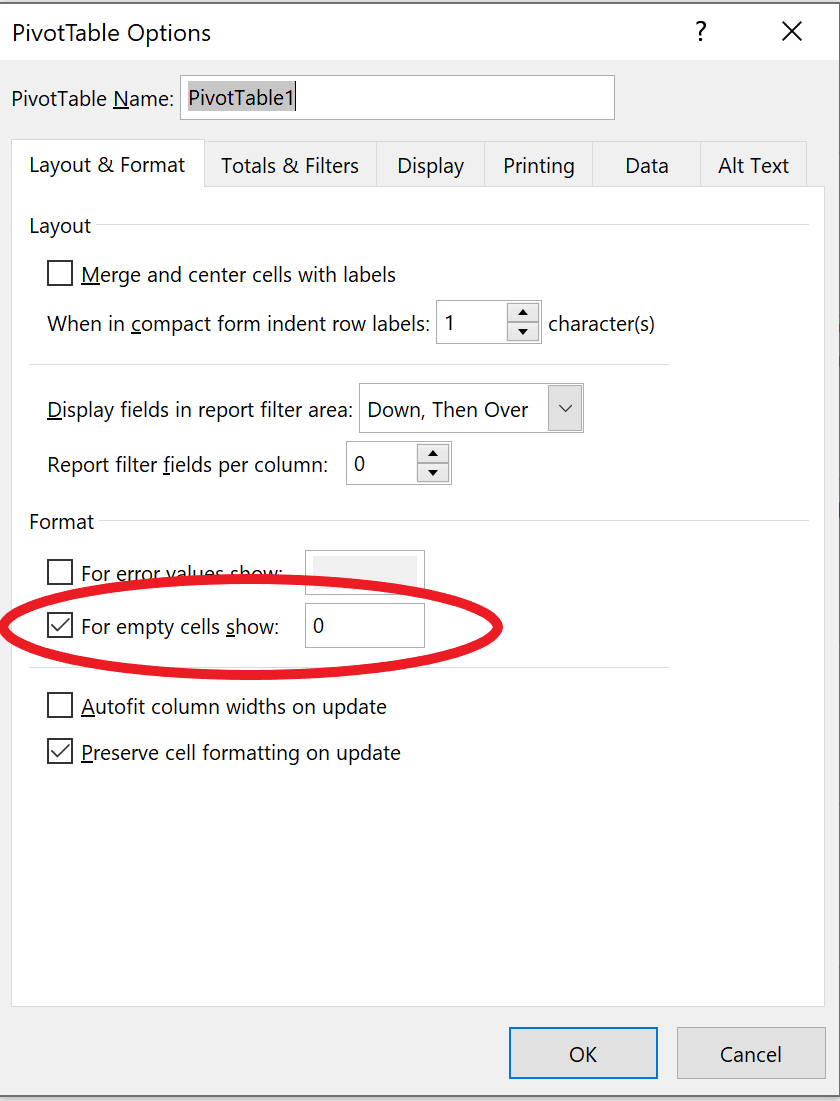
2. From the PivotChart Analyze tab in Excel, select Options, the check the box "For empty cells show", and insert "0".
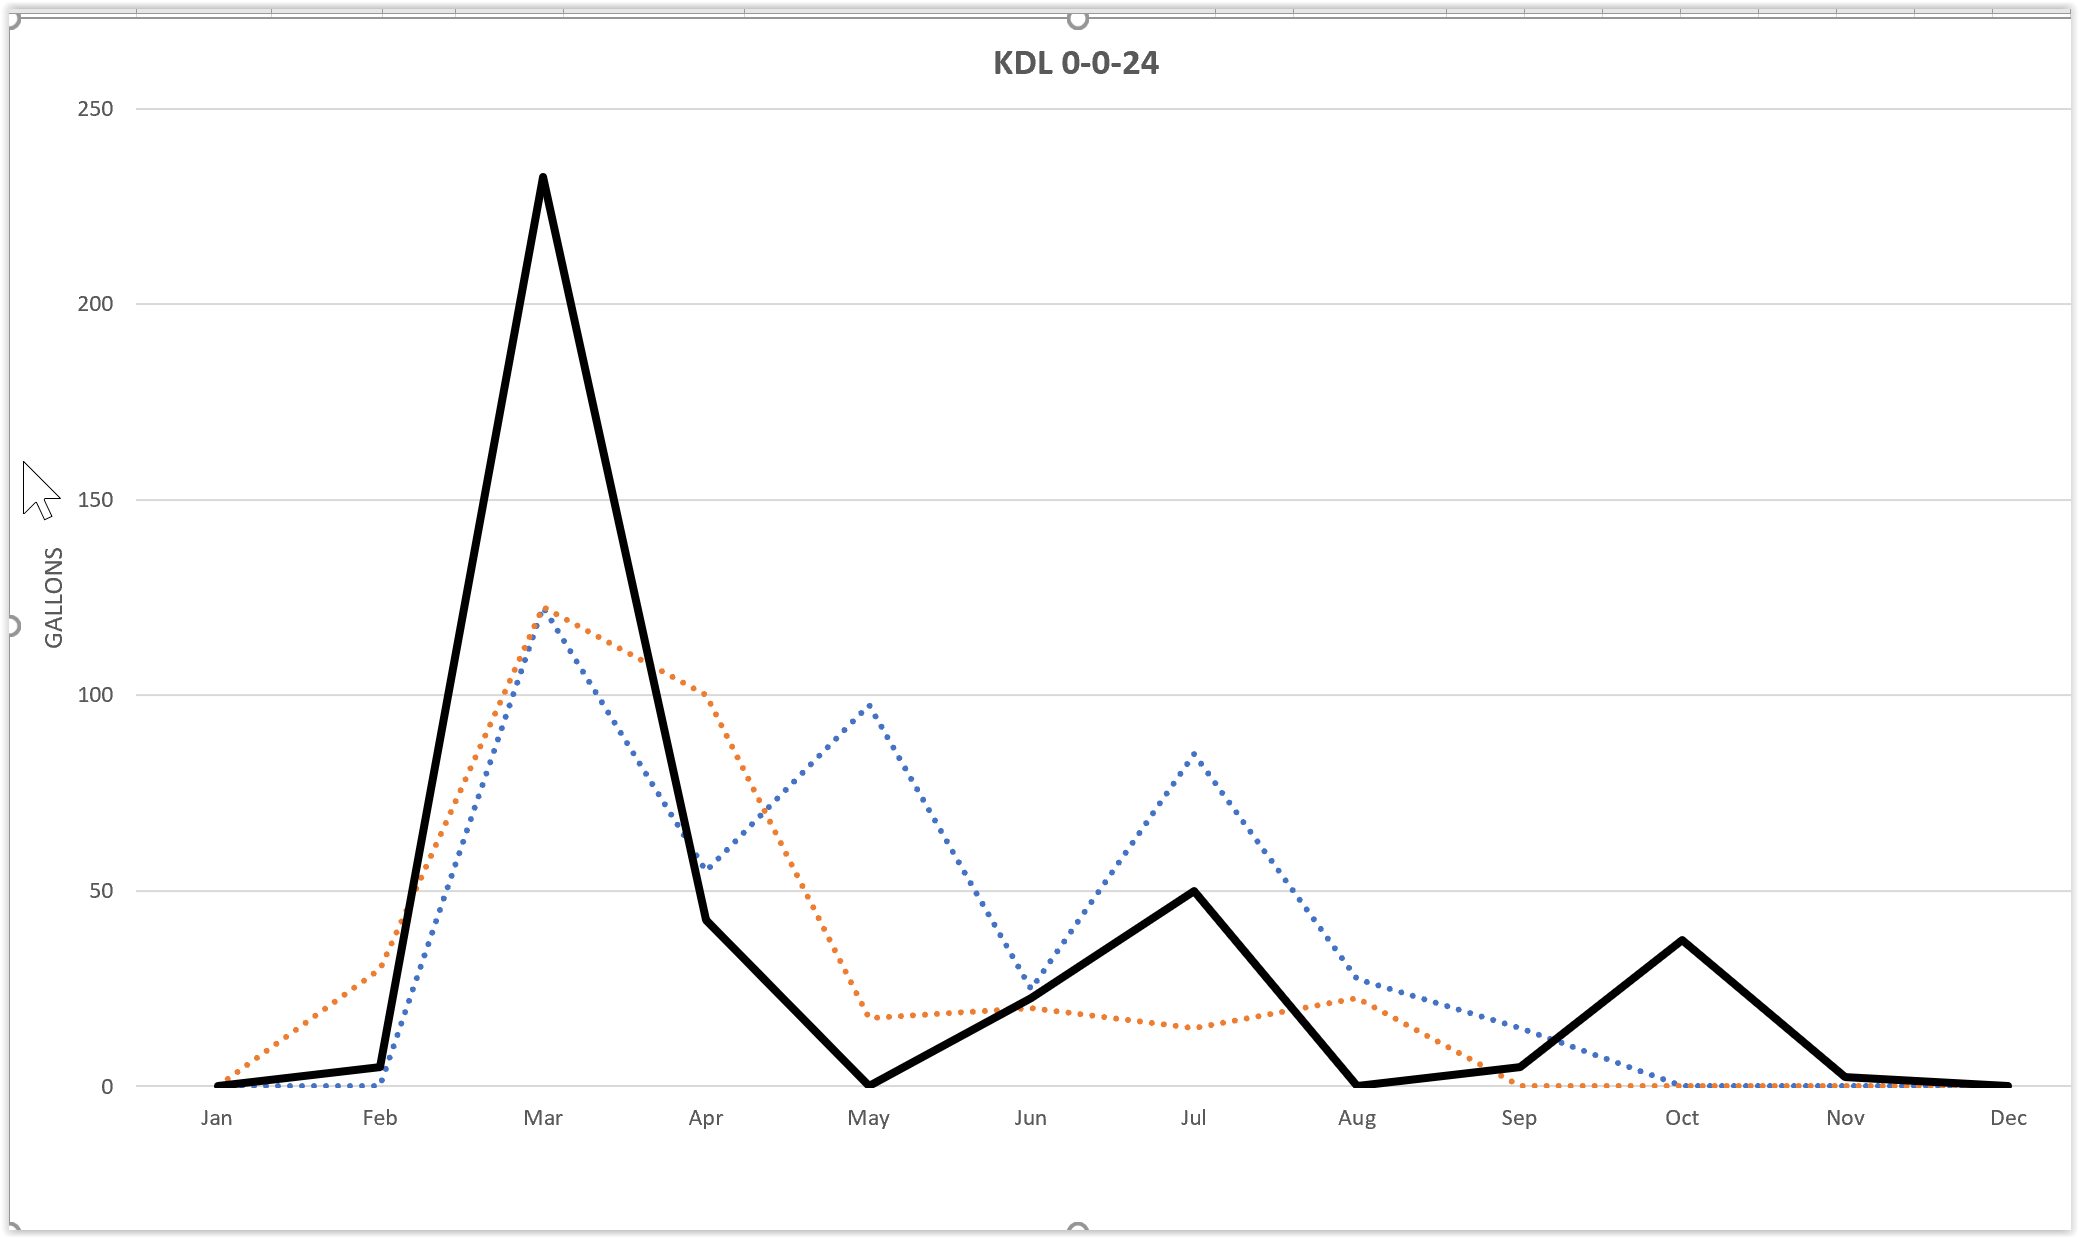
Got this result:
1. Created a "Calendar table" from the data file. In power pivot, selected the data file / Design Tab / Create Date Table. Then associated the date fields between the data table and the newly created calendar table. Closed the PowerPivot window and go back to Excel.
2. From the PivotChart Analyze tab in Excel, select Options, the check the box "For empty cells show", and insert "0".
Got this result:
ASKER CERTIFIED SOLUTION
membership
This solution is only available to members.
To access this solution, you must be a member of Experts Exchange.
Good solution, Jeff..
https://www.myonlinetraininghub.com/display-missing-dates-in-excel-pivottables