SQL Server Query for detecting, eliminating outliers from data set.
I am having trouble making a SQL Server query for eliminating outliers in a data set (using median not Std Deviation) and detecting whether the count on either side of the median is even or odd. For even numbers I will need to use the middle 2 numbers and divide by 2 to be accurate. Below is the Query I have so far. I am using SQL Server 2012.
Below code works fine for retrieving quartiles for ALL of the data - with outliers.
Please help!
Below code works fine for retrieving quartiles for ALL of the data - with outliers.
Please help!
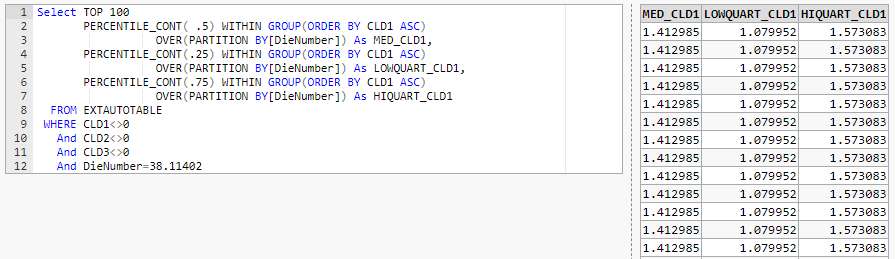
Select TOP 100 PERCENTILE_CONT(.5) WITHIN GROUP(ORDER BY[" & Metric1 & "] ASC) OVER(PARTITION BY[DieNumber]) As MED" & Metric1 & ", PERCENTILE_CONT(.25) WITHIN GROUP(ORDER BY[" & Metric1 & "] ASC) OVER(PARTITION BY[DieNumber]) As LOWQUART" & Metric1 & ", PERCENTILE_CONT(.75) WITHIN GROUP(ORDER BY[" & Metric1 & "] ASC) OVER(PARTITION BY[DieNumber]) As HIQUART" & Metric1 & " FROM EXTAUTOTABLE WHERE CLD1<>0 And CLD2<>0 And CLD3<>0 And DieNumber=38.11402Scott Pletcher
That doesn't look like SQL Server syntax. You may need to change the tag(s) on the q.
formatted sql
Select TOP 100
       PERCENTILE_CONT( .5) WITHIN GROUP(ORDER BY[" & Metric1 & "] ASC)
                  OVER(PARTITION BY[DieNumber]) As MED" & Metric1 & ",
       PERCENTILE_CONT(.25) WITHIN GROUP(ORDER BY[" & Metric1 & "] ASC)
                  OVER(PARTITION BY[DieNumber]) As LOWQUART" & Metric1 & ",
       PERCENTILE_CONT(.75) WITHIN GROUP(ORDER BY[" & Metric1 & "] ASC)
                  OVER(PARTITION BY[DieNumber]) As HIQUART" & Metric1 & "
  FROM EXTAUTOTABLE
 WHERE CLD1<>0
   And CLD2<>0
   And CLD3<>0
   And DieNumber=38.11402
can you add a sample data and show what is needed
or what is wrong with current query
or what is wrong with current query
ASKER
Thanks Kurt for the reply.
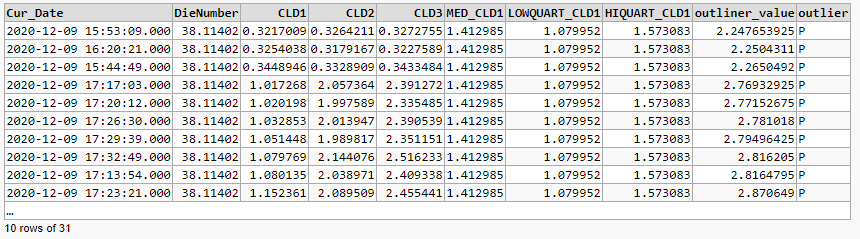
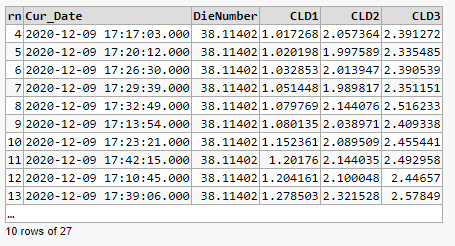
Below is a data list of that is the subject of this query. As you can see there are 3 rows at the top of the list that are obviously not normal to the data in the rest of the table. I need to be able to do 2 things - for constructing a Box and Whiskers Chart and a trend chart. 1. Be able to eliminate the rows of data in any given data set (in this case the top 3) as a part of the charts to be included in the visualization. 2. Be able to calculate the median of the data in case of even number of data points on either side of the median or odd number of data points on either side of the median. FYI if the number is even calculation must be made to divide the middle 2 numbers by 2 to return the average.
The attached file is copy of data from an SQL database.Sample Data.xlsx
and what is metric you are passing here?
anyways, I used CLD1
 now need to understand the rest :)
https://dbfiddle.uk/?rdbms=sqlserver_2019&fiddle=6d17a5659b324831904c2d19808548fb
now need to understand the rest :)https://dbfiddle.uk/?rdbms=sqlserver_2019&fiddle=6d17a5659b324831904c2d19808548fb
As you can see there are 3 rows at the top of the list that are obviously not normal to the data in the rest of the table.
now we need to convert this ENGLISH to SQL language...
what it can be?
and why you put top 100?
any reason for that?
without any kind of ordering, "top 100" is unpredictable...
ASKER
I have order by in the query I posted originally - Select TOP 100 PERCENTILE_CONT(.5) WITHIN GROUP(ORDER BY[" & Metric1 & "] ASC) . I want the visualization to show the last 100 points of data. The ordering is for the metric (Metric1). Have to use this to build the box and whiskers chart.
top 100 and ordering is ok
but my question is what is the logic for "wrong data"
first you should explain this so we can find how to translate that into SQL language...
for example: "remove top 10 bottom 10 records, order ascending..."
or
find average of first 2, compare it with first
find average of first 3, compare it with second
find average of first 4, compare it with third
...
if there is a jump here, like maybe 10%
then cut-off those records...
not sure, but we need to find a logic first...
ASKER
You would calculate the difference between the max of the 1st and 3rd Quartiles and use their difference as the Inter-quartile range (IQR). Multiplying this by 1.5 and adding that product to the 75 percentile and subracting it from the 25 percentile of the final population used gives you the limits beyond which are the outliers. Positive outliers and negative outliers. Putting all of this in a single select statement giving me the result with the conditions I previously mentioned is what I am having trouble with.
Thanks
Thanks
something like this
with d as (Select TOP 100 *,
       PERCENTILE_CONT( .5) WITHIN GROUP(ORDER BY CLD1 ASC)
                  OVER(PARTITION BY[DieNumber]) As MED_CLD1,
       PERCENTILE_CONT(.25) WITHIN GROUP(ORDER BY CLD1 ASC)
                  OVER(PARTITION BY[DieNumber]) As LOWQUART_CLD1,
       PERCENTILE_CONT(.75) WITHIN GROUP(ORDER BY CLD1 ASC)
                  OVER(PARTITION BY[DieNumber]) As HIQUART_CLD1
  FROM EXTAUTOTABLE
 WHERE CLD1<>0
   And CLD2<>0
   And CLD3<>0
   And DieNumber=38.11402
)
select d.*,
            ((case when HIQUART_CLD1>LOWQUART_CLD1 then HIQUART_CLD1 else LOWQUART_CLD1 end)*1.5
            + 0.75*CLD1
            - 0.25*MED_CLD1) outliner_value,
       case when
            ((case when HIQUART_CLD1>LOWQUART_CLD1 then HIQUART_CLD1 else LOWQUART_CLD1 end)*1.5
            + 0.75*CLD1
            - 0.25*MED_CLD1) > 0
       then 'P'
       else 'N'
       end as outlier
from d
I updated the query above, in my previous post
please refresh...
check the value of outliner_value...
I guess if you fix the formula, then you can filter them out...
please refresh...
check the value of outliner_value...
I guess if you fix the formula, then you can filter them out...
ok, I found a nice article about the method you describe, but I could not get what is all about...
https://www.wikihow.com/Calculate-Outliers
will check and adjust the query when I have time...
https://www.wikihow.com/Calculate-Outliers
will check and adjust the query when I have time...
some progress...
but looks like not correct, or is it?
if this is correct, your final query should be
if you want 100 records, then adjust numbers in query q
ie make it 25+26/2, 50+51/2, 75+76/2
with d as (
Select top 30 row_number() over (order by CLD1) rn, *
FROM EXTAUTOTABLE
WHERE CLD1<>0
And CLD2<>0
And CLD3<>0
And DieNumber=38.11402
), q as (
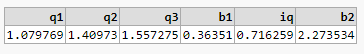
select
(select cld1 from d where rn=8) Q1,
((select cld1 from d where rn=15)+(select cld1 from d where rn=16)) / 2 Q2,
(select cld1 from d where rn=23) Q3
),
qi as (
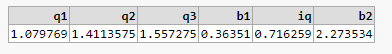
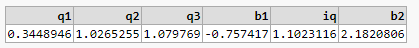
select q1,q2,q3, (q1 - ((q3-q1)*1.5)) b1, (q3-q1)*1.5 iq, (q3 + ((q3-q1)*1.5)) b2
from q)but looks like not correct, or is it?
if this is correct, your final query should be
with d as (
Select top 30 row_number() over (order by CLD1) rn, *
  FROM EXTAUTOTABLE
 WHERE CLD1<>0
   And CLD2<>0
   And CLD3<>0
   And DieNumber=38.11402
), q as (
select
  (select cld1 from d where rn=8) Q1,
  ((select cld1 from d where rn=15)+(select cld1 from d where rn=16)) / 2 Q2,
  (select cld1 from d where rn=23) Q3
),
qi as (
select q1,q2,q3, (q1 - ((q3-q1)*1.5)) b1, (q3-q1)*1.5 iq, (q3 + ((q3-q1)*1.5)) b2
 from q)
--select * from qi
select *
  from d
 where cld1 < (select b1 from qi) or
cld3 > (select b2 from qi)if you want 100 records, then adjust numbers in query q
ie make it 25+26/2, 50+51/2, 75+76/2
I updated my post
please refresh...
please refresh...
ASKER
Thanks Kurt!! I will go through this as soon as I can. I will get back to you.
Thanks again for your help!!
Rick
Thanks again for your help!!
Rick
ASKER
Is there some reason why you used row numbers to find the quartile Q values instead of NTILE(4) or percentile(xx)?
no reason, i never used those functions...
but first, lets get the correct result, so, we can adjust/simplify the code later... my query may be wrong, need to check formulas again...
the boundries looked wrong to me... maybe it is because you gave 30 records! can you attach 100 rows of data?
also, are you ok with t-sql code? or does it have to be one query?
with those function,
the ones outside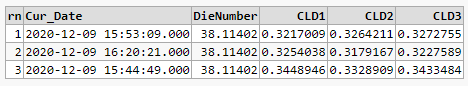
the ones inside boundaries
the ones outside
with d as (
Select top 100 row_number() over (order by CLD1) rn, *
FROM EXTAUTOTABLE
WHERE CLD1<>0
And CLD2<>0
And CLD3<>0
And DieNumber=38.11402
), q as (
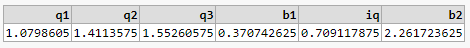
select top 1 PERCENTILE_CONT( .5) WITHIN GROUP(ORDER BY CLD1 ASC)
OVER(PARTITION BY[DieNumber]) As Q2,
PERCENTILE_CONT(.25) WITHIN GROUP(ORDER BY CLD1 ASC)
OVER(PARTITION BY[DieNumber]) As Q1,
PERCENTILE_CONT(.75) WITHIN GROUP(ORDER BY CLD1 ASC)
OVER(PARTITION BY[DieNumber]) As Q3
FROM d
),
qi as (
select q1,q2,q3, (q1 - ((q3-q1)*1.5)) b1, (q3-q1)*1.5 iq, (q3 + ((q3-q1)*1.5)) b2
from q
)
--select * from qi
select *
from d
where cld1<(select b1 from qi) or
cld1>(select b2 from qi)the ones inside boundaries
with d as (
Select top 100 row_number() over (order by CLD1) rn, *
  FROM EXTAUTOTABLE
 WHERE CLD1<>0
   And CLD2<>0
   And CLD3<>0
   And DieNumber=38.11402
), q as (
select top 1 PERCENTILE_CONT( .5) WITHIN GROUP(ORDER BY CLD1 ASC)
                  OVER(PARTITION BY[DieNumber]) As Q2,
       PERCENTILE_CONT(.25) WITHIN GROUP(ORDER BY CLD1 ASC)
                  OVER(PARTITION BY[DieNumber]) As Q1,
       PERCENTILE_CONT(.75) WITHIN GROUP(ORDER BY CLD1 ASC)
                  OVER(PARTITION BY[DieNumber]) As Q3
 FROM d
),
qi as (
select q1,q2,q3, (q1 - ((q3-q1)*1.5)) b1, (q3-q1)*1.5 iq, (q3 + ((q3-q1)*1.5)) b2
 from q
)
--select * from qi
select *
  from d
 where cld1>=(select b1 from qi) and
cld1<=(select b2 from qi)ASKER
more dataSample Data.xlsx
ASKER
Thanks Curt - this is a big help.
It looks like I would need to use your initial method above if the count of the data list is even in order to get an accurate median (value at line number 50 and 51 for 100 data points). (Line 50 value + line 51 value) / 2
It looks like I would need to use your initial method above if the count of the data list is even in order to get an accurate median (value at line number 50 and 51 for 100 data points). (Line 50 value + line 51 value) / 2
I guess I dont need any more data
last post looks correct to me...
last post looks correct to me...
PERCENTILE_CONT(.25) WITHIN GROUP(ORDER BY CLD1 ASC)
or
adding rec with row=25,26 and dividing by 2 should be same for 100 recordset...
you can use both solutions, they should be same...
or
adding rec with row=25,26 and dividing by 2 should be same for 100 recordset...
you can use both solutions, they should be same...
ASKER
Does this give me the actual median regardless of the number of row in the data set? Is this included in the SQL function for PERCENTILE_CONT(.5)?
PERCENTILE_CONT( .5) WITHIN GROUP(ORDER BY CLD1 ASC) OVER(PARTITION BY[DieNumber]) As Q2,
PERCENTILE_CONT( .5) WITHIN GROUP(ORDER BY CLD1 ASC) OVER(PARTITION BY[DieNumber]) As Q2,
ASKER CERTIFIED SOLUTION
membership
This solution is only available to members.
To access this solution, you must be a member of Experts Exchange.
ASKER
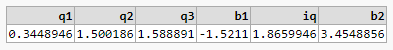
In this the top query should be more accurate since there is no value between row 15 and 16 - right?
if I use
PERCENTILE_DISC
PERCENTILE_CONT
ROW_NUMBER Logic, hard coded number, fixed number of rows
PERCENTILE_DISC
PERCENTILE_CONT
ROW_NUMBER Logic, hard coded number, fixed number of rows
it is up to you...
if number is always 100, you can use ROW_NUMBER logic
otherwise, use any other
they look very close
and it does not matter too much for your case...
if number is always 100, you can use ROW_NUMBER logic
otherwise, use any other
they look very close
and it does not matter too much for your case...
ASKER
What is difference between PERCENTILE_DISC and PERCENTILE_CONT??
I tried using PERCENTILE_DISC before I got an error using it.
I tried using PERCENTILE_DISC before I got an error using it.
ASKER
That is true for this case, but if the user changes the number of data points used in the visualization - particularly lower number of samples it could make a big difference.
here there is an explanation about those functions
I could not find what exactly those functions return...
I could not find what exactly those functions return...
What Does PERCENTILE_CONT Do?
https://www.red-gate.com/simple-talk/sql/t-sql-programming/what-does-percentile_cont-do/ASKER
When i tried using PERCENTILE_DISC I got an unrecognized function error. Does that make sense in SQL Server 2012?
for example, I used top 10
and I get, ROW_NUMBER (3,5-6,8), PERCENTILE_CONT, PERCENTILE_DISC
firs 3 records is bad in all cases...
as the sample decreases, margins get bigger
as the number of off-lines increases margin get bigger
and I get, ROW_NUMBER (3,5-6,8), PERCENTILE_CONT, PERCENTILE_DISC
firs 3 records is bad in all cases...
as the sample decreases, margins get bigger
as the number of off-lines increases margin get bigger
they should be both added with SQL 2012...
ASKER
The smaller the sampling the more important the method to be used.
I tried in 2014, both works fine
I dont have 2012 version, I am testing on https://dbfiddle.uk/
I dont have 2012 version, I am testing on https://dbfiddle.uk/
The smaller the sampling the more important the method to be used
but, to me, it looks, the smaller the sample, meaningless is this method :)
ASKER
Thanks very much for your help Kurt!!
I will mark one of these as solution.
I assume if I have further questions for this or other matters with SQL I can contact you?
I will mark one of these as solution.
I assume if I have further questions for this or other matters with SQL I can contact you?
ASKER
Yes, that is very true - smaller sampling does not indicate application for the tolls I am developing here. User must use discretion.
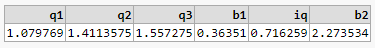
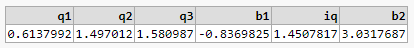
for sample of 100, I loaded your sample, TOP 100
ROW_NUMBER (25-26, 50-51, 75-76)


https://dbfiddle.uk/?rdbms=sqlserver_2019&fiddle=a55e9fbd6bb4870ea58f996f724e6ecb
ROW_NUMBER (25-26, 50-51, 75-76)
https://dbfiddle.uk/?rdbms=sqlserver_2019&fiddle=a55e9fbd6bb4870ea58f996f724e6ecb
ASKER
That is interesting. This would not yield any of the top 3 rows as outliers. I don't have negative values in the data set.
but this is what you gave me :)
and this is what I got from that page I posted above to find outliners...
formula is correct...
if you dont like outcome of this method, you should find any other method :)
and this is what I got from that page I posted above to find outliners...
formula is correct...
if you dont like outcome of this method, you should find any other method :)
ASKER
I understand. This is correct. I will designate one of these as the solution.
Can I call on your expertise in the future?
Can I call on your expertise in the future?
sure,
If i have time and havent given up solving issues here
I can help you :)
If i have time and havent given up solving issues here
I can help you :)
ASKER
Thanks!!
ASKER
Hi Kurt,
I have another question. I am getting an error - "Invalid object name 'd' ". In this query.
Thanks for you help.
Rick
I have another question. I am getting an error - "Invalid object name 'd' ". In this query.
Thanks for you help.
Rick
I am getting an error - "Invalid object name 'd' "
need to see the exact query...
probably you gave different aliases to select queries within "with" statement...
ASKER
WITH d AS (
SELECT TOP 200 Row_Number() OVER (ORDER BY CLD1) RowNo, CLD1, DieNumber
FROM [Manual_Data].[dbo].[EXTAUTOTABLE]
WHERE CLD1<>0 AND CLD2<>0 AND CLD3<>0 AND DieNumber = 38.11402), INITFILTER
AS (
SELECT TOP 1 PERCENTILE_CONT(.5) WITHIN GROUP(ORDER BY[CLD1] ASC) OVER(PARTITION BY[DieNumber])
As MEDCLD1, PERCENTILE_CONT(.25) WITHIN GROUP(ORDER BY[CLD1] ASC) OVER(PARTITION BY[DieNumber])
As LOWQUARTCLD1, PERCENTILE_CONT(.75) WITHIN GROUP(ORDER BY[CLD1] ASC) OVER(PARTITION BY[DieNumber])
As HIQUARTCLD1 FROM d), QUARTTABLE
AS (
SELECT LOWQUARTCLD1, MEDCLD1, HIQUARTCLD1, (LOWQUARTCLD1 - ((HIQUARTCLD1 - LOWQUARTCLD1) * 1.5)) LOWBOUNDARY, ((HIQUARTCLD1 - LOWQUARTCLD1) * 1.5) MEDIAN, (HIQUARTCLD1 + ((HIQUARTCLD1 - LOWQUARTCLD1) * 1.5)) HIBOUNDARY
FROM INITFILTER)
SELECT *
FROM QUARTTABLE
SELECT *
FROM d
WHERE CLD1>=(SELECT HIBOUNDARY FROM QUARTTABLE) AND CLD1<=(SELECT LOWBOUNDARY FROM QUARTTABLE)ASKER
When I use '--' I get a syntax error.
ASKER
I sent you the query.
delete these, Line 13-14
SELECT * FROM QUARTTABLEASKER
Well that definitely took away the errors, but now I get an empty table.
ASKER
Thanks Kurt. I changed the inequalities in the logic and got the table i was looking for.
Thanks very much for the help.
Thanks very much for the help.
or delete the other query :)

WITH d AS (
  SELECT TOP 200 Row_Number() OVER (ORDER BY CLD1) RowNo, CLD1, DieNumber
    FROM [EXTAUTOTABLE]
   WHERE CLD1<>0 AND CLD2<>0 AND CLD3<>0 AND DieNumber = 38.11402),
INITFILTER AS (
  SELECT TOP 1
         PERCENTILE_CONT(.50) WITHIN GROUP(ORDER BY[CLD1] ASC) OVER(PARTITION BY[DieNumber]) As MEDCLD1,
         PERCENTILE_CONT(.25) WITHIN GROUP(ORDER BY[CLD1] ASC) OVER(PARTITION BY[DieNumber]) As LOWQUARTCLD1,
         PERCENTILE_CONT(.75) WITHIN GROUP(ORDER BY[CLD1] ASC) OVER(PARTITION BY[DieNumber]) As HIQUARTCLD1
    FROM d),
QUARTTABLE AS (
  SELECT LOWQUARTCLD1, MEDCLD1, HIQUARTCLD1, (LOWQUARTCLD1 - ((HIQUARTCLD1 - LOWQUARTCLD1) * 1.5)) LOWBOUNDARY, ((HIQUARTCLD1 - LOWQUARTCLD1) * 1.5) MEDIAN, (HIQUARTCLD1 + ((HIQUARTCLD1 - LOWQUARTCLD1) * 1.5)) HIBOUNDARY
    FROM INITFILTER)
SELECT *
FROM QUARTTABLE ASKER
Thanks
ASKER
Hello Kurt,
I am working with this query more and doing a deeper dive into the data and I have found that the quartile statistics the query is giving me (LOQCLD1, HIQCLD1). These statistics are giving me results based on the entire database not on the top 25 defined in the table 'd'. Below is the current code.
I am working with this query more and doing a deeper dive into the data and I have found that the quartile statistics the query is giving me (LOQCLD1, HIQCLD1). These statistics are giving me results based on the entire database not on the top 25 defined in the table 'd'. Below is the current code.
WITH d AS (
SELECT TOP 25 Row_Number() OVER (ORDER BY Cur_Date DESC) RowNo, CLD1, DieNumber, Cur_Date
FROM [Manual_Data].[dbo].[EXTAUTOTABLE]
WHERE CLD1<>0 AND CLD2<>0 AND CLD3<>0 AND DieNumber = 38.11402 AND LineSpeed<>0), IFILTER
AS (
SELECT TOP 1 PERCENTILE_CONT(.5) WITHIN GROUP(ORDER BY[CLD1] ASC) OVER(PARTITION BY[DieNumber])
As MEDCLD1, PERCENTILE_CONT(.25) WITHIN GROUP(ORDER BY[CLD1] ASC) OVER(PARTITION BY[DieNumber])
As LOQCLD1, PERCENTILE_CONT(.75) WITHIN GROUP(ORDER BY[CLD1] ASC) OVER(PARTITION BY[DieNumber])
As HIQCLD1 FROM d), QTABLE
AS (
SELECT LOQCLD1, MEDCLD1, HIQCLD1, (LOQCLD1 - ((HIQCLD1 - LOQCLD1) * 1.5)) LOBOUND, ((HIQCLD1 - LOQCLD1) * 1.5) MEDIAN, (HIQCLD1 + ((HIQCLD1 - LOQCLD1) * 1.5)) HIBOUND
FROM IFILTER)
SELECT * FROM QTABLE
query on Line 6-7-8-9 uses d, which is Line 2-3-4
and that is top 25 row filtered by where conditions
it cannot query all table, just the d...
this is the data used subsequent queries...
and that is top 25 row filtered by where conditions
it cannot query all table, just the d...
this is the data used subsequent queries...
WITH d AS (
SELECT TOP 25 Row_Number() OVER (ORDER BY Cur_Date DESC) RowNo, CLD1, DieNumber, Cur_Date
FROM [Manual_Data].[dbo].[EXTAUTOTABLE]
WHERE CLD1<>0 AND CLD2<>0 AND CLD3<>0 AND DieNumber = 38.11402 AND LineSpeed<>0)
SELECT * FROM dASKER
Thanks Kurt.
I understand that, but the percentile part of the query is not drawing from 'd'. It is getting the calculations from the EXTAUTOTABLE. You can see from result of that part of the query that the LOQCLD1 and HIQCLD1 are not even in the 'd' data set.
LOQCLD1 MEDCLD1 HIQCLD1 LOBOUND MEDIAN HIBOUND
1.01295483112335 1.41298532485962 1.59658193588257 0.137514173984528 0.875440657138824 2.47202259302139