Power BI - Column Chart - X-axis won't sort by Month-Year
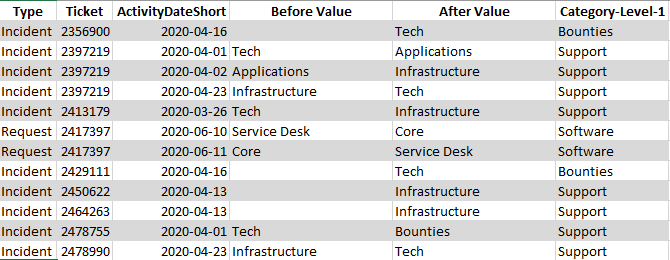
I have a table of help desk tickets. Each ticket can have multiple transfers taken on it and the date in epoch format is recorded for each. This table is imported from MS SQL where I use DATEADD in the select to create the date.
Sample:
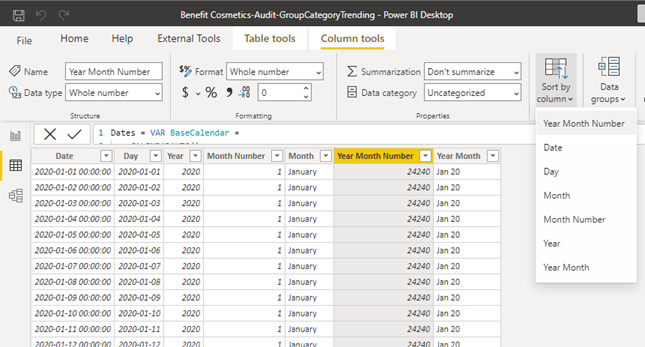
I have a separate Date table created via DAX:
Date_Table_Sort.png
Note that I have sorted by the Year Month Number.
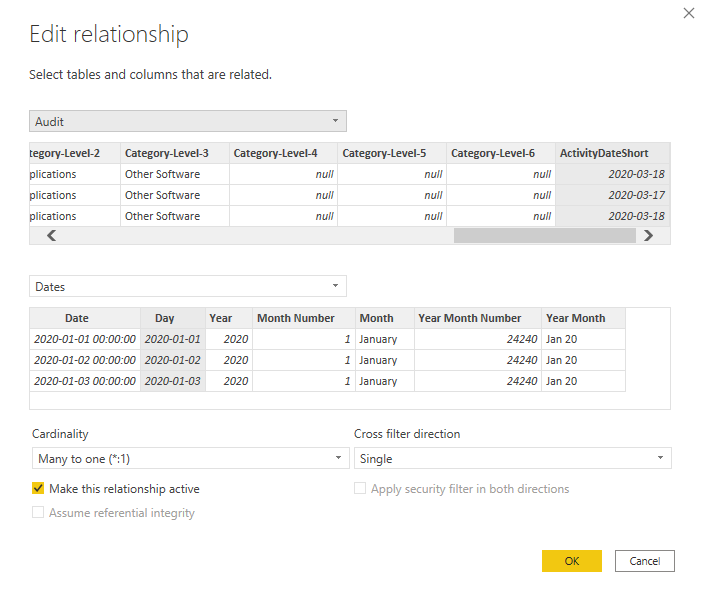
Here is the date relationship between the tables:
Date_Relationship.png
But when I try to create my column chart, the X-axis will not sort when I use the Year Month label, but works when I use the Year Month Number.
Screenshot:
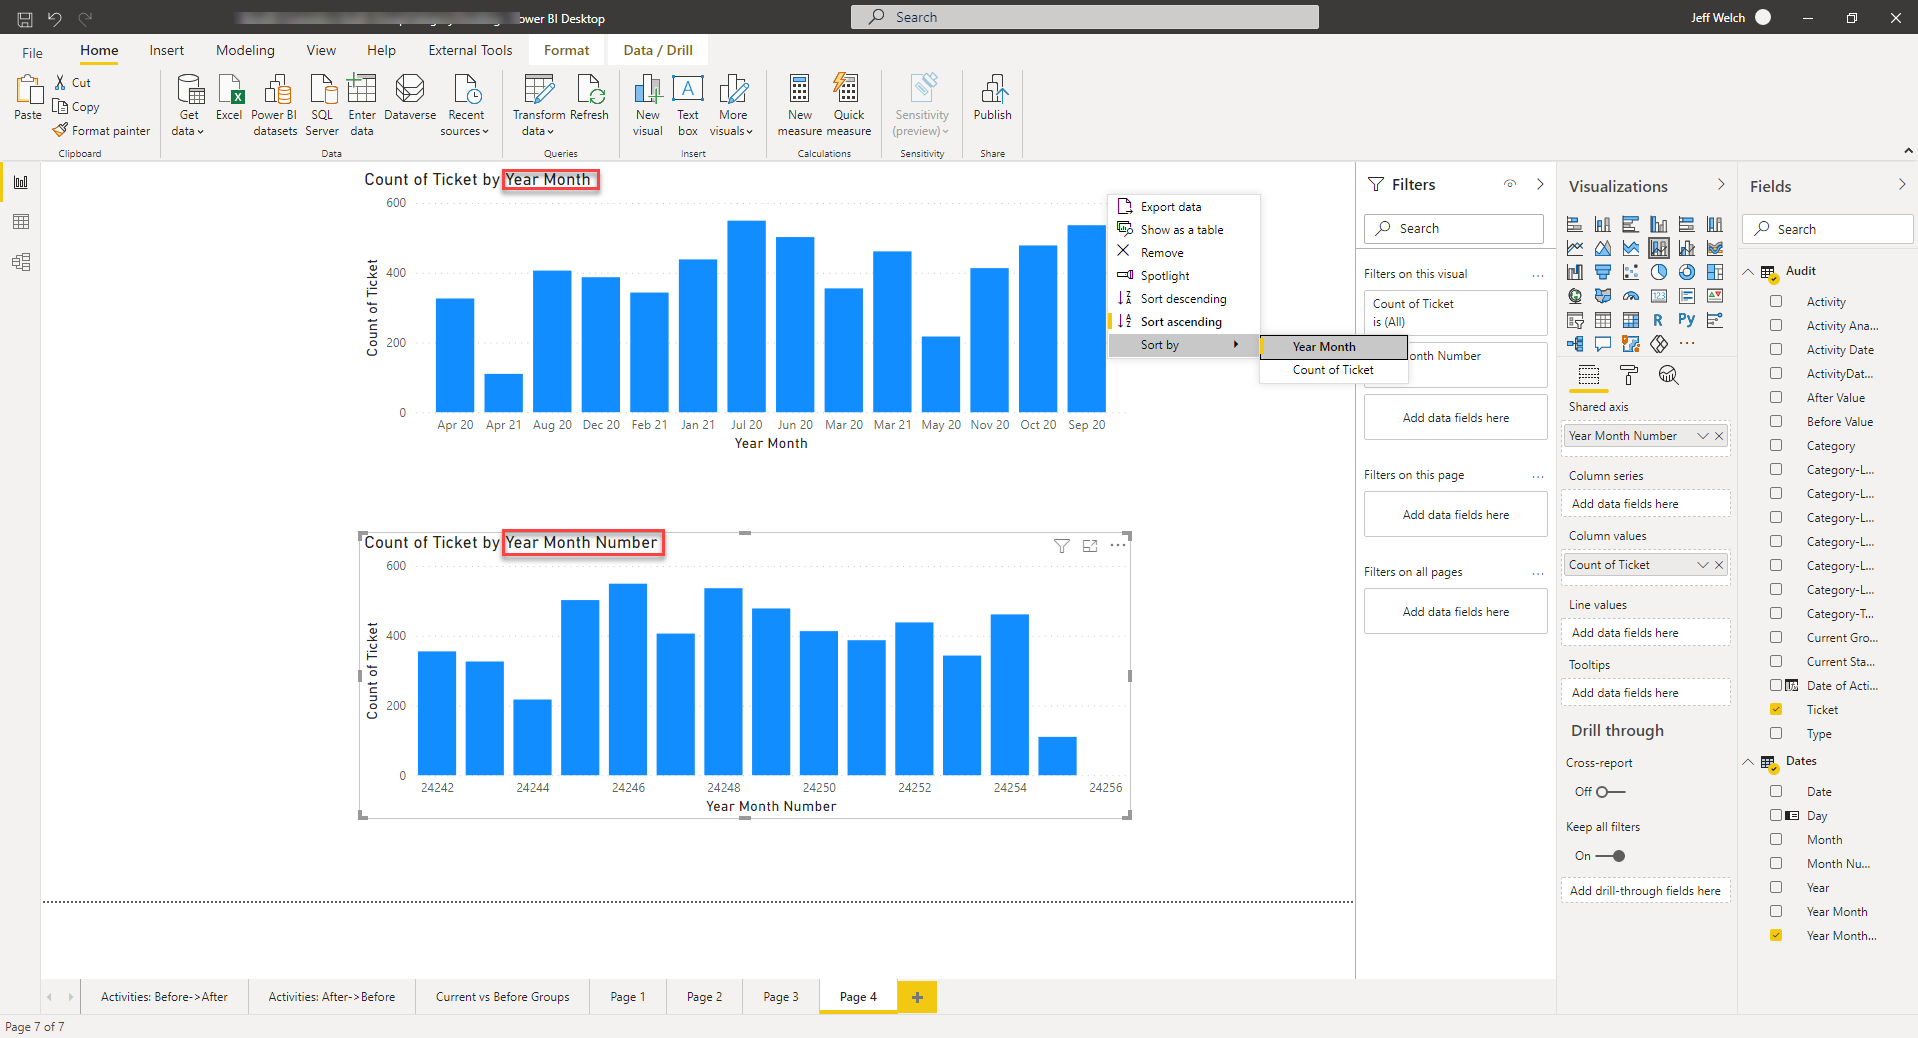
(Note this also happens if I changed the Date table sort to Month Number and then try just one Year and then just show Months, they are not in order by Month Name)
I've checked and the YearMonthNumber does increment by 1 per month across years.
Thanks in advance,
'Breeze
Sample:
I have a separate Date table created via DAX:
Dates = VAR BaseCalendar =
    CALENDARAUTO()
RETURN
    GENERATE (
        BaseCalendar,
        VAR BaseDate = [Date]
        VAR YearDate = YEAR ( BaseDate )
        VAR MonthNumber = MONTH ( BaseDate )
        VAR MonthName = FORMAT ( BaseDate, "mmmm" )
        VAR YearMonthName = FORMAT ( BaseDate, "mmm yy" )
        VAR YearMonthNumber = YearDate * 12 + MonthNumber - 1
        RETURN ROW (
            "Day", FORMAT (BaseDate, "short date"),
            "Year", YearDate,
            "Month Number", MonthNumber,
            "Month", MonthName,
            "Year Month Number", YearMonthNumber,
            "Year Month", YearMonthName
        )
    )
Date_Table_Sort.png
Note that I have sorted by the Year Month Number.
Here is the date relationship between the tables:
Date_Relationship.png
But when I try to create my column chart, the X-axis will not sort when I use the Year Month label, but works when I use the Year Month Number.
Screenshot:
(Note this also happens if I changed the Date table sort to Month Number and then try just one Year and then just show Months, they are not in order by Month Name)
I've checked and the YearMonthNumber does increment by 1 per month across years.
Thanks in advance,
'Breeze
ASKER CERTIFIED SOLUTION
membership
This solution is only available to members.
To access this solution, you must be a member of Experts Exchange.
'Breeze - You look like you have a good understanding of DAX. You should participate in question regarding PowerBI and PowerPivot. There aren't a lot of people out here with this experience yet.
ASKER
'Breeze