need help with Pearson's correlation test in Excel
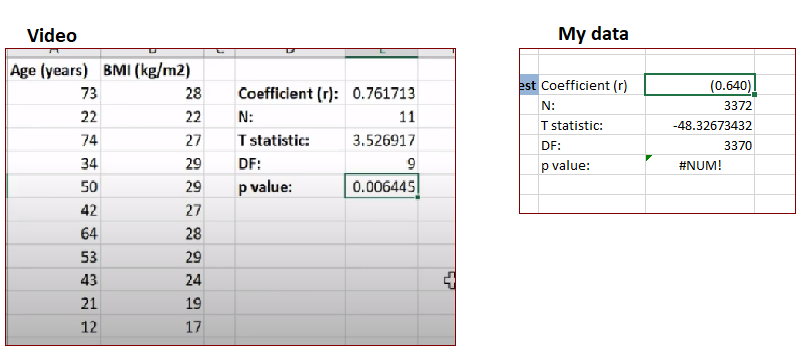
I ran CORREL in Excel, and the results matched expectations ===> minus -.640, which makes perfect sense for my data. I was also able to replicate this number from an earlier analysis, but I had to reconstitute the dataset. In the earlier analysis, they used SPSS and got .628 correlation, so I believe my Excel analysis got the same result. (I'm sure that .628 was also minus -0.628 based on the data and reality).
Next I ran a PEARSON correlation in Excel, and also got minus -0.640, same as CORREL. So again, good I thought ...
But then I got some additional stats based on this video, and the p-value calculation went wacky (#NUM). So I'm not sure what's going on. Also, the T statistic is way higher than the example.
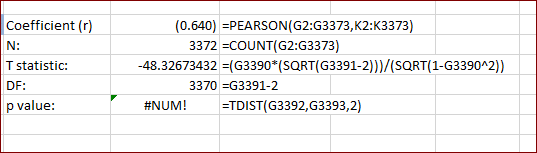
Formulas:
So trying to sort this out ...
- is the T statistic wacky?
- why didn't p value calculate?
Next I ran a PEARSON correlation in Excel, and also got minus -0.640, same as CORREL. So again, good I thought ...
But then I got some additional stats based on this video, and the p-value calculation went wacky (#NUM). So I'm not sure what's going on. Also, the T statistic is way higher than the example.
Formulas:
So trying to sort this out ...
- is the T statistic wacky?
- why didn't p value calculate?
ASKER
Jackie Man,
right, I understand that. I think the original study of +.628 is actually minus -0.628, because I know the data. The data tells whether the predictive factor (Variable A) (h.s. grades and such) translates to college success (the factor being rank-in-class). So negative correlation makes sense - the higher the predictive factor, the "higher" the class rank, but the highest person is ranked # 1, so it's a negative correlation.
-.640 is completely reverse of .628.
right, I understand that. I think the original study of +.628 is actually minus -0.628, because I know the data. The data tells whether the predictive factor (Variable A) (h.s. grades and such) translates to college success (the factor being rank-in-class). So negative correlation makes sense - the higher the predictive factor, the "higher" the class rank, but the highest person is ranked # 1, so it's a negative correlation.
But then I got some additional stats based on this video...
Can you tell me more about the video?
You need to normalize your data with ABS function before you calculate the p value.
https://support.microsoft.com/en-us/office/abs-function-3420200f-5628-4e8c-99da-c99d7c87713c?ui=en-US&rs=en-IE&ad=IE
Can you tell me more about the video?
You need to normalize your data with ABS function before you calculate the p value.
https://support.microsoft.com/en-us/office/abs-function-3420200f-5628-4e8c-99da-c99d7c87713c?ui=en-US&rs=en-IE&ad=IE
ASKER
sorry, here's the right video link. But the bottom line from the video is the calculations from my screen shots.
None of the data has a negative value so doesn't need ABS, here's a sample
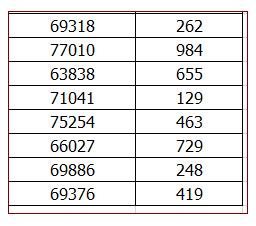
None of the data has a negative value so doesn't need ABS, here's a sample
ASKER CERTIFIED SOLUTION
membership
This solution is only available to members.
To access this solution, you must be a member of Experts Exchange.
Have you checked your data?