Average date between two dates in Power BI using DAX
Average date between two dates in Power BI using DAX not working.
ASKER
Hi Cedric,
I did that but it only returns the Date difference but not the Average in the second part.
I did that but it only returns the Date difference but not the Average in the second part.
ASKER
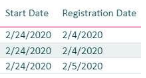
Here is the result. I get the same result for Average but it should be different.
Duration2 = DATEDIFF('Table2'[Registration Date], RELATED('Table1'[Start Date]), DAY)
Average # of Days = AVERAGE('Table2'[Duration2])

Duration2 = DATEDIFF('Table2'[Registration Date], RELATED('Table1'[Start Date]), DAY)
Average # of Days = AVERAGE('Table2'[Duration2])
ASKER

ASKER
Here. Same result for DateDiff and Average. Why?
Duration2 = DATEDIFF('Table2'[Registration Date], RELATED('Table1'[Start Date]), DAY)
Average # of Days = AVERAGE('Table2'[Duration2])

Duration2 = DATEDIFF('Table2'[Registration Date], RELATED('Table1'[Start Date]), DAY)
Average # of Days = AVERAGE('Table2'[Duration2])
The measure will calculate the average based on the dimension you selected. If you just show the same list in the visual the 2 will give exactly the same result with the total average at the bottom.
If you want to show the total average next to each line you can just do it with a custom column:
If you want to show the total average next to each line you can just do it with a custom column:
Average # of Days = Sum(Table2[Duration2])/count(Table2[Duration2])ASKER
Here is another Expert Example but I want the Average to show up in Every row but not in end total
This example gives the same result. Here is the result screen shot from Power Bi File. I want the Average to show up in every row instead of Total at the end?
DateDiff = DATEDIFF(Table1[Date], RELATED(Table2[Date]),DAY)

This example gives the same result. Here is the result screen shot from Power Bi File. I want the Average to show up in every row instead of Total at the end?
DateDiff = DATEDIFF(Table1[Date], RELATED(Table2[Date]),DAY)
AvgDayDiff =
AVERAGEX(
Table1, DATEDIFF(Table1[Date], RELATED(Table2[Date]),DAY))
ASKER
Hi Cedric,
Where should Table1 or Table2 go below?
Average # of Days = Sum(Table2[Duration2])/count(Table2[Duration2])
Where should Table1 or Table2 go below?
Average # of Days = Sum(Table2[Duration2])/count(Table2[Duration2])
ASKER
I tired the same formula but still gives me same numbers in the table screen shot above
ASKER
Hi,
This is not working.
How can I get the Avg # of days to show a digit instead of a whole date? Here is the screen shot and DAX
Duration = DATEDIFF('Table1'[Registration Date], RELATED('Table2'[Start Date]), DAY)
Average # of Days = DATEADD(LASTDATE('Table1'[Registration Date]), DATEDIFF(LASTDATE( 'Table1'[Registration Date]),LASTDATE('Table2'[Start Date] ),DAY)/2,DAY)
ASKER
Any Experts out there? Any ideas and suggestions?
ASKER
Why the AVERAGEX provides the same result as DATEDIFF but not the Average number of Days?
Duration = DATEDIFF(Table1'[Registration Date], RELATED(‘Table2’[Start Date]), DAY)
Average # of Days = AVERAGEX('Table1'[Registration Date]) - RELATED('Table2'[Start Date ])

Duration = DATEDIFF(Table1'[Registration Date], RELATED(‘Table2’[Start Date]), DAY)
Average # of Days = AVERAGEX('Table1'[Registration Date]) - RELATED('Table2'[Start Date ])
ASKER
Can anyone please help?
This question needs an answer!
Become an EE member today
7 DAY FREE TRIALMembers can start a 7-Day Free trial then enjoy unlimited access to the platform.
View membership options
or
Learn why we charge membership fees
We get it - no one likes a content blocker. Take one extra minute and find out why we block content.
ASKER
Average date between two dates in Power BI using DAX not working.
Is there a way to solve this using DAX?
Average days between Registration Date and Start Date (For all user IDs the difference between Start Date minus Registration Date.