Power BI - DAX how to get the Average days between two dates?
Unable to solve the Average days issue using DAX. Here is the example.
Average date between two dates in Power BI using DAX not working.
Is there a way to solve this using DAX?
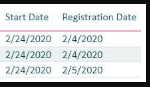
? Average days between Registration Date and Start Date (For all user IDs the difference between Start Date minus Registration Date.
Tom Farrar
Can you provide example answers for the 3 lines in you question?

ASKER
I need the third column in the image about as "Number of Days" by calculation the Average of number of days between the Start date and Registration date for a given user id. What was the average number of days when it took a given user to register for a course and when they started the course.
Where's the ID column?
ASKER
User id's are emails I can't share but assume that each user is taking a course or multiple users taking the same course. But I'm trying to find out the Average number of days using DAX based on when it took a given user to register for a course and when they started the course but I need the Average number of days as third column.
This is really urgent.
Thank you
This is really urgent.
Thank you
ASKER
I tried this but it didn't work.
Average Duration = AVERAGEX(‘Table1, DATEDIFF('Table1'[Registration Date], RELATED('Table2'[Start Date]), DAY))
Average Duration = AVERAGEX(‘Table1, DATEDIFF('Table1'[Registration Date], RELATED('Table2'[Start Date]), DAY))
ASKER
Average Duration = AVERAGEX(‘Table1', DATEDIFF('Table1'[Registration Date], RELATED('Table2'[Start Date]), DAY))
ASKER
Any ideas?
ASKER
The DATEDIFF works on both the Registration Date and start Date but the AVERAGE Does not work.
How can there be an average for a given user id? For one user the difference is what it is? That is why I asked for an example.
ASKER
I just need the Average days between Registration Date and Start Date. Do you have some code in DAX etc to do that?
ASKER
It looks like no Experts here to answer this question?
Are you trying to create a measure or a calculated column? I think you want a measure, right?
ASKER
Either works fine
seems this question is a duplicate.
ASKER
@Tom
Your example gives the same result. Here is the result screen shot from your Power Bi File. I want the Average to show up in every row instead of Total at the end?

Your example gives the same result. Here is the result screen shot from your Power Bi File. I want the Average to show up in every row instead of Total at the end?
You want the average 8.5 to show up in every row of the table, or report? EEExample.pbix
ASKER
Every row of the table.
Then you need to create a calculated column within the table. Right click the table name and select "New Column". Then add this code:
AvgDayDiff =
AVERAGEX(
All(Table1), DATEDIFF(Table1[Date], RELATED(Table2[Date]),DAY))
EEExample.pbix
AvgDayDiff =
AVERAGEX(
All(Table1), DATEDIFF(Table1[Date], RELATED(Table2[Date]),DAY))
EEExample.pbix
ASKER
When I click add Calculated Column it brings up the M Code Window. I'm not sure what other ways. Your code repeats same for all row but it should be different based on those different dates.
If you expect tp get a different answer for each row in the table, then that answer is simply subtracting one column from the other. I added a column in the table that gives you the average of all the differences, and would not understand what you are looking for without a specific example showing the two columns (apparently in different tables) and the resultant column with the values you are expecting.
As for why you are getting the M code window, I expect you are in the Power Query functionality of Power BI. That is all I can think of.
As for why you are getting the M code window, I expect you are in the Power Query functionality of Power BI. That is all I can think of.
ASKER
I also tried something like this but it does not return anything. I created a measure.
Avg # of Days =
Avg # of Days =
DATEADD( LASTDATE([Start Date]), DATEDIFF( LASTDATE([Start Date]), LASTDATE([Registration Date]), DAY )/2, DAY )ASKER
How can I get the Avg # of days to show a digit instead of a whole date? Here is the screen shot and DAX
Duration = DATEDIFF('Table1'[Registration Date], RELATED('Table2'[Start Date]), DAY)
Average # of Days = DATEADD(LASTDATE('Table1'[Registration Date]), DATEDIFF(LASTDATE( 'Table1'[Registration Date]),LASTDATE('Table2'[Start Date] ),DAY)/2,DAY)

Duration = DATEDIFF('Table1'[Registration Date], RELATED('Table2'[Start Date]), DAY)
Average # of Days = DATEADD(LASTDATE('Table1'[Registration Date]), DATEDIFF(LASTDATE( 'Table1'[Registration Date]),LASTDATE('Table2'[Start Date] ),DAY)/2,DAY)
ASKER
I also changed the Average # of Days Column to text, short date, date but I still get the whole date instead of a number as an Average. Any ideas?
ASKER
Any Experts out there? Any ideas and suggestions?
ASKER
Why the AVERAGEX provides the same result as DATEDIFF but not the Average number of Days?
Duration = DATEDIFF(Table1'[Registration Date], RELATED(‘Table2’[Start Date]), DAY)
Average # of Days = AVERAGEX('Table1'[Registration Date]) - RELATED('Table2'[Start Date ])

Duration = DATEDIFF(Table1'[Registration Date], RELATED(‘Table2’[Start Date]), DAY)
Average # of Days = AVERAGEX('Table1'[Registration Date]) - RELATED('Table2'[Start Date ])
ASKER
Can anyone please help?
Never saw the screen shot. Still would like to see a simple example...
Could try this formula---
Average Duration =
AVERAGEX(‘Table1,
'Table1'[Registration Date] - RELATED('Table2'[Start Date])
Could try this formula---
Average Duration =
AVERAGEX(‘Table1,
'Table1'[Registration Date] - RELATED('Table2'[Start Date])
ASKER
It gives the same values as Duration with DATEDIFF,
Duration = DATEDIFF(Table1'[Registration Date], RELATED(‘Table2’[Start Date]), DAY)
Average # of Days 10 =
AVERAGEX(‘Table1,
'Table1'[Registration Date] - RELATED('Table2'[Start Date])

Duration = DATEDIFF(Table1'[Registration Date], RELATED(‘Table2’[Start Date]), DAY)
Average # of Days 10 =
AVERAGEX(‘Table1,
'Table1'[Registration Date] - RELATED('Table2'[Start Date])
What value are you expecting in the Duration column?
ASKER
Duration column values are correct but not the Average # of Days 10. The following is not returning for every row but total. Also why it's the same value as duration?
Average # of Days 10 =
AVERAGEX(‘Table1,
'Table1'[Registration Date] - RELATED('Table2'[Start Date])
Average # of Days 10 =
AVERAGEX(‘Table1,
'Table1'[Registration Date] - RELATED('Table2'[Start Date])
Where are you creating the formula? Are you creating a measure for it?
ASKER
Yes I'm creating a measure.
You said:
"Duration column values are correct but not the Average # of Days 10. The following is not returning for every row but total. Also why it's the same value as duration?
Average # of Days 10 =
AVERAGEX(‘Table1,
'Table1'[Registration Date] - RELATED('Table2'[Start Date])"
My question again is:
In the example data you provided

What should the answer be in Average # of Days 10? And what is the significance of 10?
"Duration column values are correct but not the Average # of Days 10. The following is not returning for every row but total. Also why it's the same value as duration?
Average # of Days 10 =
AVERAGEX(‘Table1,
'Table1'[Registration Date] - RELATED('Table2'[Start Date])"
My question again is:
In the example data you provided
What should the answer be in Average # of Days 10? And what is the significance of 10?
ASKER
There is no significance of 10 but it's just a measure name as I have created many measures with name 1, 2 3 and so on.
The answer for the Average # of Days 10 should be = The average difference between Registration Date and Start Date. So for all users the difference between the Start Date minus the Registration Date. So every row in the screen shot should show a number displaying the average difference between the Start date minus the Registration Date. Please don't look at the duration which is correct but I can't figure out the Average difference between the start date minus the registration date?
Any ideas and codes to fix this? It has been taking long time and no experts here can help.
I look back through our comments and it feels like we are experiencing "Ground Hog Day". If you look at each line in your example the duration is the average, the average of one row. If you think it should be a different number, then like I have asked before, what should that numbers be in your example? What should show up for each line below?
ASKER
Duration is not the Average. It's the difference between two date. Here is the DAX for that.
Duration = DATEDIFF(Table1'[Registration Date], RELATED(‘Table2’[Start Date]), DAY)
But I'm looking for an average between those two dates. I don't know exactly how each rows values but it should give me the average difference of those two dates. Let's base it on users who took those courses and what was the average of those two dates when the user registered in the course and when it started. IT should show for each row the average of those dates. Any ideas?
So, back to my original question based on the data in your example:
What values would you expect to see for each row instead of 49?
What values would you expect to see for each row instead of 49?
ASKER
I don't really know what values can be there for each row for the Average. But I was thinking it should be different than the duration which is the date difference but not the average. I know you calculate Average by summing the numbers and divide by the total number but in the case I'm really lost.
Well the average for the registrations on the 22nd and starting on the 10th is 49 (49+49)/2. That is what your data shows. If one of the examples had registered on the 22nd, but started on the 20th, then the average would be 59 (49+59)/2. If you had 10 students registering on the 22nd, and each of them started on different dates, then the average would be the 10 durations added together and divided by 10.
Now if you want the average for all registrations and start dates from your example, then it would be 48.4 (49+49+48+48+48)/5. But you would get that for all the rows.
A measure is an aggregation, and is not meant to be a value line-by-line in the rows of the data.
Now if you want the average for all registrations and start dates from your example, then it would be 48.4 (49+49+48+48+48)/5. But you would get that for all the rows.
A measure is an aggregation, and is not meant to be a value line-by-line in the rows of the data.
ASKER
Thanks for the explanation. I know measure is an aggregation and in the total it shows correct average. But I tried calculated column but still same issue? Here is the result again. How can this be achieved row by row instead of showing Average at the bottom on the total.

I answered that question in an earlier comment (Dec 10th). See the formula below. I believe this will get you the total average on each line.
Generally when the total average is calculated like this it is an interim calculation. The result is used to calculate a percentage or difference from the actual.
AvgDayDiff =
AVERAGEX(
All(Table1), DATEDIFF(Table1[Date], RELATED(Table2[Date]),DAY))
Generally when the total average is calculated like this it is an interim calculation. The result is used to calculate a percentage or difference from the actual.
AvgDayDiff =
AVERAGEX(
All(Table1), DATEDIFF(Table1[Date], RELATED(Table2[Date]),DAY))
ASKER
Great. Let me try and see if it works
Thank you so much for your help.
Thank you so much for your help.
ASKER
Can I use a measure or Calculated Column for calculating the Average?
Generally I think you can use either if you calculate as shown in the formula. I think you will have more luck with a measure for reporting purposes. Not sure if you are going to use the total average to build percentages or differences from actual, or...?
ASKER
Your formula is generating the same value for all rows. There are thousands of rows with same number such as 24.84 as shown in the screen shot. It's the last column. I created both measure and Calculated column.
Average # of Days 14 =
AVERAGEX(
All(Table1), DATEDIFF(Table1[Date], RELATED(Table2[Date]),DAY))

Average # of Days 14 =
AVERAGEX(
All(Table1), DATEDIFF(Table1[Date], RELATED(Table2[Date]),DAY))
What are you trying to achieve? How are you trying to analyze the data? Do you want to know the average time it took from Registration to Start? Then take the Start Date out of the report. If you want to know the average number of days for female and male registration to start then take out the dates from the report and put in the gender column (if there is one).
If you put both dates in the report, your average is going to be the same as the duration.
If you put both dates in the report, your average is going to be the same as the duration.
ASKER
Yes. I want to know the average time it took from Registration to Start?
At what level of aggregation? If you look at each occurrence, then the average will be the same as the duration. If you look at an aggregation that has the same Registration Date and Start Date as the other occurrences in the aggregation, then the average is going to be the same as the duration. It is only when you aggregate occurrences that have different Registration Dates and/or Start Dates that the average is going to be different from the duration. As far as I am concerned, the AverageX function provided earlier is what you are needing, unless you can explain (with specific examples) what you expect the average to be for occurrences.
ASKER
Thanks for the explanation. Yes there are different Start Dates and Registration dates and I want the Average to be different than the Duration but why it's the same?
The average and duration will be different for any aggregation of different Start Dates and Registration Dates. Show meaan example where this is not the case.
ASKER
I don't understand why the Average and Duration are always same. They should be different by looking at the formulas. Here is a result and as you can see the Start date and Registration date are different but the Duration and Average columns have the same value for each row. I'm really running out of time ad ideas. Any ideas?

ASKER
How to solve the above?
For all user id's the difference between the start date minus the registration date?
Lets say you have user id1, user id2 and so on.
For all user id's the difference between the start date minus the registration date?
Lets say you have user id1, user id2 and so on.
You can't put the start date, registration date and duration in the visual together. The duration will be the same as the average for each row. Take the dates and duration out of the visual and put in the UserID (assuming a user has registered and started multiple classes that he/she registered and started on different times), then you will see a different average.
ASKER
I did that and just using the Average in the screen shot below but it shows the datediiff for duration instead of AverageX. User id is hidden in this screen shot. If you look at the dates for average it's showing the DateDiff instead of Average here. I just have to be 100% sure it's calculating the Average before deploying the report for business users but not the DateDiff. How can you verify mathematically the average is correct between the start date and registration date by looking at the result below? Please help.

The average measure result is filter context, that means if you include the dates in the visual your duration and average will be the same. Show me the same visual without the dates, and including the User ID only and the Average # Of Days.
ASKER
Ok. I can not show user id's here but the user id's are repeating in the visual so one user can have registration in multiple courses and the average number is repeating.. But I need to prove it to the report consumers the the average is correct but not sure how?
What are you including the report visual besides the User ID and Average?
ASKER
Ok so what I did was first I exported the visual to Excel with all those columns and then removed all those column but only included user id and Average # of Days columns in Excel and exported them. Then I looked at one user id which was repeating 5 times in the first visual with all those columns including start date and registration date. So I looked at all those 5 values for dates and average numbers for that user and summed them up and used Average Formula and I got 55 which is correct. But now how I can display that user id just one time in the visual to get the 55 as Average for example?

The problem is you are using is a calculated column if the data resides in the table. You need to create a measure. It will aggregate the data by user in the report and give you a consolidated average.
In the Power BI visual go to the table where the data resides, right-click and select "New Measure". Then post the formula you have for the average in as the new measure. It will show up under the table in the view, and add that to your visual and take out the one that came from the table (the calculated column).
In the Power BI visual go to the table where the data resides, right-click and select "New Measure". Then post the formula you have for the average in as the new measure. It will show up under the table in the view, and add that to your visual and take out the one that came from the table (the calculated column).
ASKER
I'm using a measure and 100% sure.
Not if I understand this statement:
"included user id and Average # of Days columns in Excel and exported them "
"included user id and Average # of Days columns in Excel and exported them "
ASKER
Here is the measure DAX I'm using for the Average # of Days.
Measure = AVERAGEX(‘Table 1', DATEDIFF(‘Table 1’[Registration Date], RELATED(‘Table 2’[Start Date]), DAY))
Measure = AVERAGEX(‘Table 1', DATEDIFF(‘Table 1’[Registration Date], RELATED(‘Table 2’[Start Date]), DAY))
Where does that formula reside?
ASKER
The user id's are repeating and I found that the average is correct when I exported the visual in Excel and looked at the numbers. For one user there were 5 rows of different averages and I used the Average formula in Excel and I got the correct result. But how I can I fix the repeating user id's so I only get one row per user and one average number in the visual?
ASKER
Formula resides under Table 1. I created the measure under Table 1.
Okay, so you are exporting to Excel and not using the visual in Power BI?
ASKER
No. I exported in Excel to test to see if the Average values are correct. But I'm using the Visual in Power BI and need to fix the repeating user id's so I get the Average correctly in Power BI.
You should not be getting repeating items in the visual. Are the only two fields in the visual the User ID and the Average?
ASKER
No. Not only two field. I will have to add the Start Date, Registration Date and Course Title. So in total 5 fields.
ASKER
But this DAX formula is giving me the Date Difference but not the Average.
= AVERAGEX(‘Table 1', DATEDIFF(‘Table 1’[Registration Date], RELATED(‘Table 2’[Start Date]), DAY))
= AVERAGEX(‘Table 1', DATEDIFF(‘Table 1’[Registration Date], RELATED(‘Table 2’[Start Date]), DAY))
ASKER
Here the User id 1 has the five rows repeating.
User Average # of Days
User id 1 34
User id 1 49
User id 1 78
User id 1 69
User id 1 10
User id 1 92.
The Average should be 55.33 in the Average # of Days column. But it's repeating as when I add the courses because this user has registered in 6 courses for example. Is there a way I can add a drill down and add the Average underneath the 6 rows for this user in the Visual?
How are you linking the two tables? The Registration and Start tables?
ASKER
One start date table can have many registrations so 1-many from the start date table to the Registration date table. Then I use the RELATED Function in the DAX.
= AVERAGEX(‘Table 1', DATEDIFF(‘Table 1’[Registration Date], RELATED(‘Table 2’[Start Date]), DAY))
= AVERAGEX(‘Table 1', DATEDIFF(‘Table 1’[Registration Date], RELATED(‘Table 2’[Start Date]), DAY))
Okay, let me adjust for one-to-many...
ASKER
Thank you so much for providing me a working Power BI example and I do really appreciate it. But your example gives me the same result. I see it as DateDiff instead of Average. So it means it's never possible if you add the user with multiple courses and you get multiple rows with different averages right? When I remove the other columns then I see the total average. But why I see it as the date difference instead of the Average? How do you read or explain the DAX below?
AverageDays =
AVERAGEX(Register, DATEDIFF(Register[RegisterDate], RELATED('Start'[StartDate]), DAY))
AverageDays =
AVERAGEX(Register, DATEDIFF(Register[RegisterDate], RELATED('Start'[StartDate]), DAY))
I am not sure1 what exactly your problem is, but my example had two tables (which I believe you have). Table1 is "Register" and Table2 is "Start". If you look at the tables in my Power BI example and you will see there is one register date for each of the 4 employees, and two start dates for each of the four employees. That is the one-to-many relationship you have (I believe). Then when I build the measure below:
AVERAGEX('Start', DATEDIFF( RELATED(Register[RegisterDate]), 'Start'[StartDate], DAY))
The one side of the relationship is the first table RELATED() in the DateDiff equation and the many side of the relationship is the table (Start) is the second table. This is "not" the formula you provided to me in you last answer.
ASKER
Ok fair enough. But how can I explain this formula in words?
AVERAGEX('Start', DATEDIFF( RELATED(Register[RegisterDate]), 'Start'[StartDate], DAY))
AVERAGEX('Start', DATEDIFF( RELATED(Register[RegisterDate]), 'Start'[StartDate], DAY))
ASKER
Your example is one-to-one relationship.

ASKER CERTIFIED SOLUTION
membership
This solution is only available to members.
To access this solution, you must be a member of Experts Exchange.
Yes, my original Power BI was one-to-one, but I revised that the second time once I knew what you had done. You need to look at the second example of the file.
ASKER
Great. But you forgot to send me the second example?
ASKER
Ok. Thank you so much. Let me check
ASKER
Perfect. I will accept your solution. But is there a way I can generate a table visual with expand-collapse or drill-down? For example if one user has registered in multiple course and the average shows up in multiple rows but underneath those rows for this user id I can show the cumulative average?
ASKER
I will try that. Thank you so much for helping me out on this issue and I do really appreciate it. I will accept your solution above. I have few more questions which I will post as new questions but those questions are bit different.
Thank you.
Thank you.
You can get the drill down by creating a hierarchy. See video. Use the Matrix for the video for table drill-down.
EEExample.pbix
https://www.youtube.com/watch?v=tZoBHwS_5rc
EEExample.pbix
https://www.youtube.com/watch?v=tZoBHwS_5rc
Thanks...
ASKER
I will try the hierarchy. The hierarchy example you provided looks good.
Thank you
Thank you
ASKER
@ Tom Farrsar,
How to group by on a course and get the average score for the courses for students in Power Bi?
For example I would like to calculate the average score and group bi course id. Any examples would be great.
Thank you.
How to group by on a course and get the average score for the courses for students in Power Bi?
For example I would like to calculate the average score and group bi course id. Any examples would be great.
Thank you.
All you need to do is create a visual with the Average Measure and add only the course ID. The average calculation is done at whatever level the report shows. That is what they call "filter context". Try it and validate.
ASKER
Did you mean by creating an Average measure on the course id?
No you do not need to do that. The average measure should work at any level of reporting. If you do it by student it should give you the student average; if you do it by course it should give you the course average. Try it and check the result.
ASKER
But there are two columns involved. Course Id and Score columns. How can this be achieved in just one Average measure? I'm trying to calculate the average score nd group those on course id column.
I am going to need to see an example of what you are talking about when you say two columns. In the example below I have two hierarchies. One by User and Class; the other by Class and User. So you can see the average for a user and drill down to the individual classes, or you can see the average for the class and drill down to the individual users in that class.
EEExample.pbix
EEExample.pbix
ASKER
If I just create an Average measure and add in the score column it repeats for same course id multiple times. But I want one row per course and the Average score. How can this be achieved?
Don't put the score column in the visual, or create a hierarchy with the course as the highest hierarchy and the score as the lowest. Just like the example I sent you.
ASKER
If I don't put the score column in the visual then it doesn't serve the purpose and it's a requirement to show the average score in the visual. Is there another way to achieve this without creating an hierarchy ?
ASKER
Any DAX examples?
Show me how you would expect the results to look. Look at my example three posts up...
You need to get this down to one question. You should not have multiple post on the same question....
You need to get this down to one question. You should not have multiple post on the same question....
ASKER
If it works then I will accept your solution in the original post for this question.
Look at my example three posts up.. Which one? The one with hierarchy?
Look at my example three posts up.. Which one? The one with hierarchy?
https://filedb.experts-exchange.com/incoming/2022/01_w02/1582628/EEExample.pbix
What is the problem with the hierarchy?
What is the problem with the hierarchy?
ASKER
I posted a new question in a new post. Can you please answer this?