asked on
Windows Server 2008 r2 becoming unstable requiring daily reboot
We have recently noticed several of our 2008 servers have been anonymously been running to the point of instability which requires a reboot daily possibly 10-13 servers. After doing some research we have located this.
12 Jan 2022 05:51:13.3872022-01-12 05:51:10 SERVERNAMEINQUESTION 3 2004 EVENTLOG_WARNING_TYPE #582648 Microsoft-Windows-Resource-Exhaustion-Detector Windows successfully diagnosed a low virtual memory condition. The following programs consumed the most virtual memory: sqlservr.exe (2108) consumed 1040777216 bytes, ReportingServicesService.exe (2600) consumed 267190272 bytes, and LogMeIn.exe (41316) consumed 185761792 bytes.
It looks like something is causing these services to trigger low virtual memory which become unstable to the point of no return. We have also located this in the log.
1151 Thu Dec 30 15:48:59 2021 Instrumentation Service Voltage sensor value unknown Sensor location: PS1 Voltage 1 Chassis location: Main System Chassis Previous state was: OK (Normal) Voltage sensor value (in Volts): 0.000
1151 Thu Dec 30 15:48:59 2021 Instrumentation Service Voltage sensor value unknown Sensor location: PS2 Voltage 2 Chassis location: Main System Chassis Previous state was: OK (Normal) Voltage sensor value (in Volts): 0.000
Dells OMSA has shown the same warnings but no failures.
Has anyone seen these types of situations happen and has anyone been able to determine a cause and a possible fix to resolve?
We are having to reboot 10-13 servers every morning to stabilize things.
ASKER
Here is some additional info
In context: 2022-01-11 19:36:36.957 2022-01-11 14:36:30 3 2004 EVENTLOG_WARNING_TYPE #288572 Microsoft-Windows-Resource-Exhaustion-Detector Windows successfully diagnosed a low virtual memory condition. The following programs consumed the most virtual memory: sqlservr.exe (2176) consumed 1520644096 bytes, LMIGuardianSvc.exe (88432) consumed 1088512000 bytes, and AgentService.exe (604) consumed 442245120 bytes. 2022-01-11 19:41:38.354 2022-01-11 14:41:34 3 2004 EVENTLOG_WARNING_TYPE #288573 Microsoft-Windows-Resource-Exhaustion-Detector Windows successfully diagnosed a low virtual memory condition. The following programs consumed the most virtual memory: sqlservr.exe (2176) consumed 1520640000 bytes, LMIGuardianSvc.exe (88432) consumed 1088512000 bytes, and AgentService.exe (604) consumed 442245120 bytes. 2022-01-11 19:46:44.762 2022-01-11 14:46:38 3 2004 EVENTLOG_WARNING_TYPE #288574 Microsoft-Windows-Resource-Exhaustion-Detector Windows successfully diagnosed a low virtual memory condition. The following programs consumed the most virtual memory: sqlservr.exe (2176) consumed 1520640000 bytes, LMIGuardianSvc.exe (88432) consumed 1088536576 bytes, and AgentService.exe (604) consumed 442118144 bytes. 2022-01-11 19:52:01.222 2022-01-11 14:51:54 3 2004 EVENTLOG_WARNING_TYPE #288575 Microsoft-Windows-Resource-Exhaustion-Detector Windows successfully diagnosed a low virtual memory condition. The following programs consumed the most virtual memory: sqlservr.exe (2176) consumed 1520644096 bytes, LMIGuardianSvc.exe (88432) consumed 1088512000 bytes, and AgentService.exe (604) consumed 442105856 bytes. 2022-01-11 19:57:02.622 2022-01-11 14:56:58 3 2004 EVENTLOG_WARNING_TYPE #288576 Microsoft-Windows-Resource-Exhaustion-Detector Windows successfully diagnosed a low virtual memory condition. The following programs consumed the most virtual memory: sqlservr.exe (2176) consumed 1520640000 bytes, LMIGuardianSvc.exe (88432) consumed 1088512000 bytes, and AgentService.exe (604) consumed 442736640 bytes. 2022-01-11 20:02:09.053 2022-01-11 15:02:02 3 2004 EVENTLOG_WARNING_TYPE #288577 Microsoft-Windows-Resource-Exhaustion-Detector Windows successfully diagnosed a low virtual memory condition. The following programs consumed the most virtual memory: sqlservr.exe (2176) consumed 1520644096 bytes, LMIGuardianSvc.exe (88432) consumed 1088536576 bytes, and AgentService.exe (604) consumed 442245120 bytes. 2022-01-11 20:07:15.463 2022-01-11 15:07:08 3 2004 EVENTLOG_WARNING_TYPE #288578 Microsoft-Windows-Resource-Exhaustion-Detector Windows successfully diagnosed a low virtual memory condition. The following programs consumed the most virtual memory: sqlservr.exe (2176) consumed 1520640000 bytes, LMIGuardianSvc.exe (88432) consumed 1088536576 bytes, and AgentService.exe (604) consumed 442245120 bytes. 2022-01-11 20:12:21.881 2022-01-11 15:12:14 3 2004 EVENTLOG_WARNING_TYPE #288579 Microsoft-Windows-Resource-Exhaustion-Detector Windows successfully diagnosed a low virtual memory condition. The following programs consumed the most virtual memory: sqlservr.exe (2176) consumed 1520586752 bytes, LMIGuardianSvc.exe (88432) consumed 1088512000 bytes, and AgentService.exe (604) consumed 442138624 bytes. 2022-01-11 20:17:18.251 2022-01-11 15:17:14 3 2004 EVENTLOG_WARNING_TYPE #288580 Microsoft-Windows-Resource-Exhaustion-Detector Windows successfully diagnosed a low virtual memory condition. The following programs consumed the most virtual memory: sqlservr.exe (2176) consumed 1520586752 bytes, LMIGuardianSvc.exe (88432) consumed 1088512000 bytes, and AgentService.exe (604) consumed 442224640 bytes. 2022-01-11 20:22:24.676 2022-01-11 15:22:20 3 2004 EVENTLOG_WARNING_TYPE #288581 Microsoft-Windows-Resource-Exhaustion-Detector Windows successfully diagnosed a low virtual memory condition. The following programs consumed the most virtual memory: sqlservr.exe (2176) consumed 1520640000 bytes, LMIGuardianSvc.exe (88432) consumed 1088536576 bytes, and AgentService.exe (604) consumed 442224640 bytes. 2022-01-11 20:27:26.069 2022-01-11 15:27:20 3 2004 EVENTLOG_WARNING_TYPE #288582 Microsoft-Windows-Resource-Exhaustion-Detector Windows successfully diagnosed a low virtual memory condition. The following programs consumed the most virtual memory: sqlservr.exe (2176) consumed 1520640000 bytes, LMIGuardianSvc.exe (88432) consumed 1088512000 bytes, and AgentService.exe (604) consumed 442843136 bytes.
ASKER

ASKER
Good news is it found nothing related.
Conhost Svchost and powershell are still running multiple times on all of these servers I know we have SSRS in the background but not sure if that would be part of the cause.

ASKER
You really should push for an upgrade budget...
Also try multiple scanners do double check for infections...
There have been several major attacks that have come out since 2008 EOL...
ASKER
something could be configured to not check if another instance is running and launches another one and has an issue causing it to not terminate
i would change the columns in task manager to show the command line; this could help to see exactly what is running
ASKER
ASKER
ASKER
Here is the system idle process on 1 of the servers rebooting only temp fixes it... It has to be something in GPO but where would or possibly what policy?
ASKER
Can anyone recommend a good DMP file reader I am having trouble trying to look at these. Or if someone is versed in dmp files can possibly tell me what the cause of these to repeat in memory.
The power shell dump is almost 200 megs I cant upload it here.
ASKER
Microsoft (R) Windows Debugger Version 10.0.22473.1005 AMD64
Copyright (c) Microsoft Corporation. All rights reserved.
Loading Dump File [C:\Users\andre\Downloads\conhost.dmp]
User Mini Dump File with Full Memory: Only application data is available
Symbol search path is: srv*
Executable search path is:
Windows 7 Version 7601 (Service Pack 1) MP (4 procs) Free x64
Product: Server, suite: TerminalServer SingleUserTS
Machine Name:
Debug session time: Fri Jan 14 10:49:55.000 2022 (UTC - 5:00)
System Uptime: 8 days 17:21:21.582
Process Uptime: 8 days 17:21:06.000
..............
For analysis of this file, run !analyze -v
ntdll!NtReplyWaitReceivePort+0xa:
00000000`777e985a c3 ret
NatVis script unloaded from 'C:\Program Files\WindowsApps\Microsoft.WinDbg_1.2111.9001.0_neutral__8wekyb3d8bbwe\amd64\Visualizers\atlmfc.natvis'
NatVis script unloaded from 'C:\Program Files\WindowsApps\Microsoft.WinDbg_1.2111.9001.0_neutral__8wekyb3d8bbwe\amd64\Visualizers\ObjectiveC.natvis'
NatVis script unloaded from 'C:\Program Files\WindowsApps\Microsoft.WinDbg_1.2111.9001.0_neutral__8wekyb3d8bbwe\amd64\Visualizers\concurrency.natvis'
NatVis script unloaded from 'C:\Program Files\WindowsApps\Microsoft.WinDbg_1.2111.9001.0_neutral__8wekyb3d8bbwe\amd64\Visualizers\cpp_rest.natvis'
NatVis script unloaded from 'C:\Program Files\WindowsApps\Microsoft.WinDbg_1.2111.9001.0_neutral__8wekyb3d8bbwe\amd64\Visualizers\stl.natvis'
NatVis script unloaded from 'C:\Program Files\WindowsApps\Microsoft.WinDbg_1.2111.9001.0_neutral__8wekyb3d8bbwe\amd64\Visualizers\Windows.Data.Json.natvis'
NatVis script unloaded from 'C:\Program Files\WindowsApps\Microsoft.WinDbg_1.2111.9001.0_neutral__8wekyb3d8bbwe\amd64\Visualizers\Windows.Devices.Geolocation.natvis'
NatVis script unloaded from 'C:\Program Files\WindowsApps\Microsoft.WinDbg_1.2111.9001.0_neutral__8wekyb3d8bbwe\amd64\Visualizers\Windows.Devices.Sensors.natvis'
NatVis script unloaded from 'C:\Program Files\WindowsApps\Microsoft.WinDbg_1.2111.9001.0_neutral__8wekyb3d8bbwe\amd64\Visualizers\Windows.Media.natvis'
NatVis script unloaded from 'C:\Program Files\WindowsApps\Microsoft.WinDbg_1.2111.9001.0_neutral__8wekyb3d8bbwe\amd64\Visualizers\windows.natvis'
NatVis script unloaded from 'C:\Program Files\WindowsApps\Microsoft.WinDbg_1.2111.9001.0_neutral__8wekyb3d8bbwe\amd64\Visualizers\winrt.natvis'
Microsoft (R) Windows Debugger Version 10.0.22473.1005 AMD64
Copyright (c) Microsoft Corporation. All rights reserved.
Loading Dump File [C:\Users\andre\Downloads\powershell.dmp]
User Mini Dump File with Full Memory: Only application data is available
************* Path validation summary **************
Response Time (ms) Location
Deferred srv*
Symbol search path is: srv*
Executable search path is:
Windows 7 Version 7601 (Service Pack 1) MP (4 procs) Free x64
Product: Server, suite: TerminalServer SingleUserTS
Machine Name:
Debug session time: Fri Jan 14 10:50:15.000 2022 (UTC - 5:00)
System Uptime: 8 days 17:21:41.722
Process Uptime: 7 days 16:50:00.000
................................................................
...................
Loading unloaded module list
..
For analysis of this file, run !analyze -v
ntdll!ZwWaitForSingleObject+0xa:
00000000`777e97ea c3 ret
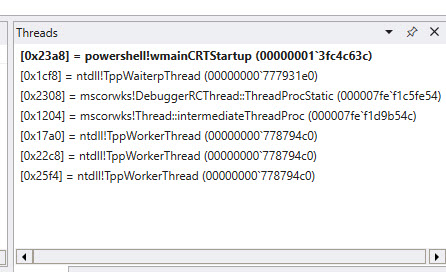
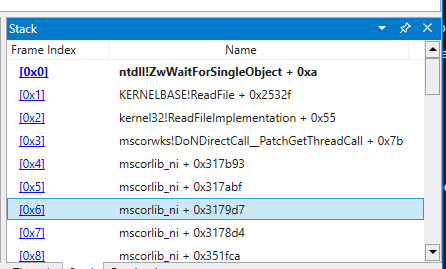
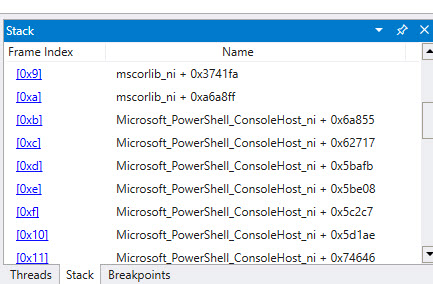
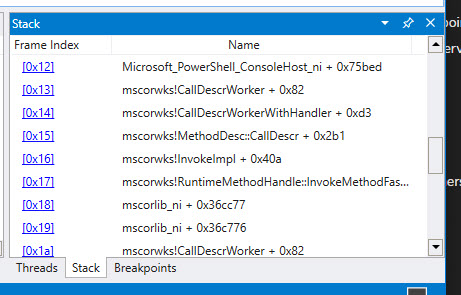
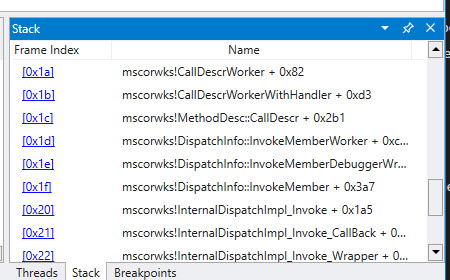
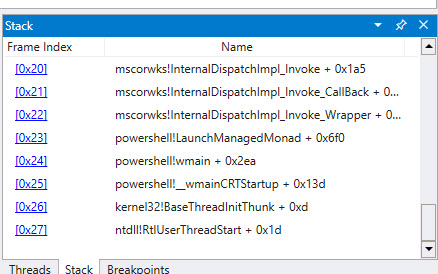
Powershell debug
ASKER
ASKER
ASKER

ASKER
ASKER
ASKER


ASKER

Are they fully up to date with the latest patches that were released?
ASKER
ASKER
Shutting off windows defender has allowed LMI to run with no memory spikes and the servers are now stable. Now the question is what is causing the 2 to conflict. That will be for LMI to device.
ASKER