asked on
Excel Table for NZ Lotto with Main and Expenses Tab
Lotto draw results excel file below updated till 30/3/22 .
I have created a Basic NZ lotto table attached here that can be modified for the below requirements lotto table.xlsx
Information:
NZ lotto has numbers from 1 to 40.
When lotto numbers are drawn, it will draw 6 numbers plus a bonus ball and a power ball.
I needed a modification of the above lotto table to including the following requirements.
Requirements:
Whenever new lotto results are updated on the nz lotto website , I need those new lotto results to automatically update the lotto table tabs namely , Sheet1 - main and Sheet2 - expenses based on the following.
Main Tab :
Whenever 3 numbers (upto 6 numbers maximum) and/or a powerball are matched, the match column to be populated please.
The match column(k:l) has two sub columns , first sub column(k) for lotto numbers match and second sub column(l) for powerball match.
Under the monitored numbers column(o:v), whenever I type any six numbers , it would show me how many times the numbers came . Also if a filter could be added to the monitored numbers column so that I can check for example, from a week upto 6 months.
Expenses Tab :
Under Expenses tab, if I could track my spending , so I don't spend over the budget.
Minimum spend per lotto transaction is $2.80 and maximum spend per lotto+powerball transaction is 6.00
There are 2 draws per week on Wed and Sat times 4 weeks is 22.40 based on $2.80 transaction.
Sometimes I might spend $6.00 per transaction also during that 4 weeks.
ASKER
I have a basic nz lotto table created so you can modify accordinglyAre you referring to what you have on the Main worksheet?
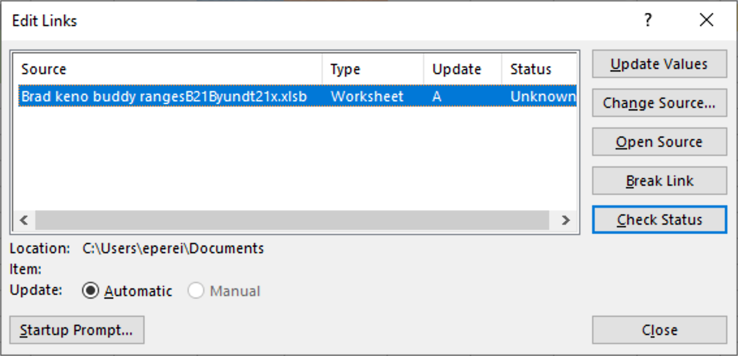
You have this link in your workbook. Do you need it?
 I assume from what you said that you want to download data frm the NZ lotto website. Unfortunately I've never done anything like that. Could it be done manually for a while?
ASKER
to apply to the basic lotto table I have attached.
ASKER
The link for download for the lotto draw results file as below
https://assets.mylotto.co.nz/assets/uploads/bb66a9fa-ae0b-11ec-a42d-3a3d57f54207.xlsx
ASKER
lotto table.xlsx
ASKER
ASKER
https://assets.mylotto.co.nz/assets/uploads/3c1f8446-b063-11ec-8d83-bf68c230783a.xlsx
I downloaded those updated lotto results from the above link, so that it can be used for the lotto table
I will update A2:A5 in my next update. You will also notice that there's a new worksheet named "Download". It is the repository for the downloaded results. I will hide that worksheet in my next update. I just noticed that when you save the workbook it also asks you to save the downloaded file. I will fix that.
29236406.xlsm
ASKER
ASKER
Example : 30 March 22, results could read as 4 5 6 15 39 40.
Which means the entire workbook results would also read in numerical order.
I'm trying to understand the requirements for the Main sheet.
You say
Whenever 3 numbers (upto 6 numbers maximum) and/or a powerball are matched, the match column to be populated please.
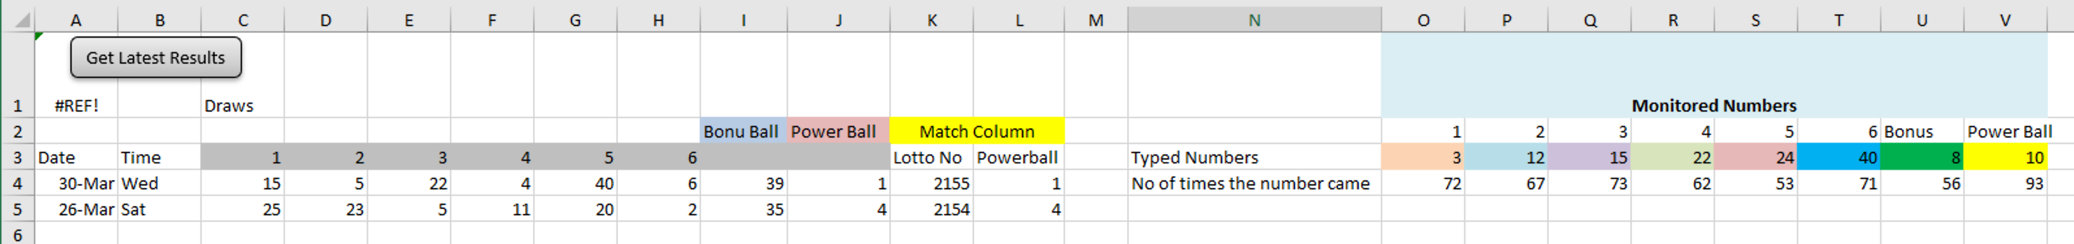
Does that mean that when you enter numbers in O3 to V3 and 3 or more numbers and/or the powerball numbers match those from the current draw that you want to show in O4 to V4 the count of how many times those numbers occur in all the past draws? If so why do you have row 5?
Also please create an updated Expenses tab with more data so I can get a better idea of what you want done there.
ASKER
When I enter the 6 numbers(between 1 & 40) plus the powerball in O3 to V3, yes it would then show counts in past draws in O4 to V4
Row 5 under Monitored Numbers (O:V) is blank
Column A is Date
Column B is Day (two draws per week , wed and sat)
Column C:J would populate results based on filters / macro buttons.
The Get Results button would update the lotto draw results in the Download Sheet Tab that you have created and which you said that you are going to keep it hidden.
The Download sheet tab is the database for extracting data to Main tab either via filters or Macro
The data from the hidden Download Tab would be used in the Main tab only when created filters in the Main tab are applied to show draws from 1 week to 6 months.
I could use the created filters to apply All wednesdays for 1 week to 6 months or choice of All Saturdays for 1 week to 6 months or between given dates
The Main tab will be populated based on Filters/Macro that is created.
Expenses Tab Scenario : lotto table1Apr.xlsx
Division 6 is 3 numbers plus Bonus Ball(for cash win)
Win Division Snapshots for Lotto Only
 Win Division Snaspshots for Powerball below
- In my testing I overwrote A1 on the Main tab. What should it be?
- I'm using formulas in C4:J5 and currently they wipe out the green fill color. Hopefully I can correct that.
- I still don't understand the "Whenever 3 numbers (upto 6 numbers maximum) and/or a powerball are matched, the match column to be populated" part. Does that mean that K4:K5 and L4:L5 will sometimes be blank?
- And is that based on the monitored numbers?

- I added formulas in row 13 columns, C, D, E and G. I will add one in F13.
- Should F7 be -6.00? If not then when should something be there?
- The formula in G13 adds up what's in C4:D12. Shouldn't its text just say just "Grand Total" and be C4:D12 minus F4:F12?
- Should the display be dynamic as the month progresses? In other words on 4/2 it would just show row 4 and on 4/6 show 4 and 5, etc?
ASKER
I would ignore that requirement for now
At this point , I would need a date(A3) and Day(B3) filter to check frequency of the hits.
Example of Date filter scenario : Period (1 March to 31 March 22.)
Example of Day filter scenario : to filter further to observe the hits for Wed or Sat.
If I choose day filter, wednesday only , I would be able to see the count of hits of all Wednesdays in the Month of March and the dates for Wednesday should still be visible.
Same way for Saturday.
Yes K4:K5 and L4:L5 will sometimes be blank and is based on the monitored numbers correct.
Yes F7 is 6.00 because the decision was to play powerball for that day.
D13 will not add up if there is no spend, only if I spend 6.00 on any given day, then D13 value will increase as you used a formula for that to happen.
G13 needs to tell me the total spend, this is very it gets tricky regarding the loss column.
I think I will not add the loss column to see how your table looks when I use your filters in the main column
I did not understand the last question about 4/2 and 4/6 , but yes the values will change when spend goes up, which means it is dynamic.
Yes F7 is 6.00 because the decision was to play powerball for that day.Does that mean that on the Expenses tab for each row that if there is a value in C and/or D that F will be the total of C+D unless E is non-blank?
I did not understand the last question about 4/2 and 4/6In your sample workbook you have all of April on the Expenses tab. I know you did that manually but what happens in May? Would you delete what's there and replace it with all the May dates? Or would you add rows below that for the whole month of May? Or something else? When I mentioned 4/2 and 4/6 what I was thinking is that in real life when April 2nd rolled around that there would be just one row for 2-Apr and on April 6th there would be a second row for 6-Apr. I'm suggesting that that could be done automatically.
One other thing. In the lotto-table1Apr.xlsx that you attached there are conditional formatting rules that refer to AC3 which is a part of an apparently abandoned Monitored Numbers section. Do you want the cells in columns C to L to match the colors in O3:V3 when the values match the monitored values?
ASKER
 A : Monitored Numbers entered in 04:v4 would populate C4:J4 based on filters you have created for 1 month to 6 months. Then I wish to apply a further filter for date(A3) and day(B3) to filter dates and days( wed or sat)
 A: Yes you could sum up C and/or D to have a total value in F. And F column could be known either as Loss or Debit Column.
 No, I would not delete April because I need to observe the record of expenses for the rest of the months in 2022.
 That means from May Month onwards I would need an Automation Button to populate future months of 2022, which means your formula would need to include 2023, 2024 for atleast upto 10 years , so that when 2023 comes, I I just hit on Automation Button and Column A and B populates automatically. So an Automation formula Button could be created to populate one month. I need to observe row 13 totals after every month
Which means at the end of each month I am observing a Total sums row which you could give a highlight colour
 You could use clear formats and use your own method for now. I will decide about the colours once I have a rough lotto table from you. And then I will be able to understand better if I am missing out anything and if I need to add a highlight colour or use another way of highlighting.
In the attached workbook:
- It can take a couple of minutes to get the data from the lotto website
- I moved the 'Get Results' button to the Main tab and changed its caption
- On the Main tab A4:J5 have formulas that get the data from the Winning Number Results (WNR) tab
- On the Main tab there is code that fills in columns K and L if there are 3 or more matches between the values in C:J and O3:V3 when any value in O3:V3 is changed. The same is true of there's only a PowerBall match.
- The counts in OV4:V4 are currently the counts in the whole WNR column. For example O4 is the count of 5s in WNR column C
- On the Expenses tab there are formulas in C12:G12 that create the totals. There are also formulas in F3:F11 and G3:G11.
ASKER
So I typed manually all the data for the month of March 22 so that you get a visual overview of how the table should look when the task is automated.
I have typed data in the same file that you sent to me and title it as 3April22

The updated file 3April22Lotto table.xlsm contains the above example.
If a Macro button can be added that can automate and do the following
2) However if I need to populate Rows for example for month of Feb 22.
I don't know what formula you could use to do that.
3) Sometimes I would want to visually view 3 month together or sometimes just a month's view .
You could then apply the above example to populate Rows 4 to 12 and test the automation.
In the example in Row17 , 3 numbers and a bonus ball hit one time on 30 Mar 22.
I typed the word "Lotto No." in K column was error on my part, please discard the Lotto No. which is a draw no 2155.
The K column is called Lotto , which would only display how many hits came(3 numbers or more and bonus/powerball), when I typed Numbers 4 5 6 12 19 32 39 and Power ball 3, there was 1 hit with numbers 4 5 6 and Bonus ball 39. So the K Lotto Column shows "1" count. And I highlighted the numbers that hit in blue manually.
I have used highlight colour blue for 4 5 6 and bonus ball cell red to match the same highlight colour used in the lotto results on the website and in the snapshot below.

1 to 9 is blue highlight
10 to 19 is orange highlight
20 to 29 is green highlight
and 30 to 40 is red highlight.
- I added a new button on the Main tab.
- When that button is clicked you will see two lists from which you should select the From and To periods. Initially the From and To that are two months previous to the current month are selected.
- You might want to consider having column 'A' show dd-mmm-yy (for example 1-Dec-21) . It would make the list clearer if, say, you chose Dec 2021 as the stating date and Jan 2022 as the ending date.
- I think that the values that you enter in O3:V3 should be validated to ensure that they are numeric, 1 to 40 and that there are no duplicates.
- All the values in the "Draws" list are now filled in via code that’s behind the new button.
- Column AK is hidden; I’m using it as a helper column for that process.
ASKER
Yes, please add dd-mm-yy to the formula so that list is clear like you said.
I did not understand no 4. I think that..................................duplicates?
I clicked on View data button for the periods Jan 22 to March 22 and in the following snapshot it looks as follows

In Row 12(29 Jan22) and similarly Row 23(9Mar22) , 3 numbers or more not matched at all , but Power Ball no. 3 got a highlight in above snapshot and also what is the other number 3 next to the draw 2138.
 Row 22 (5Mar) and Row 29 (30 Mar) have worked correctly because 3 or more numbers have matched.
Could you please change to numerical order only the draw numbers between C:H. ( eg : 2 13 24,etc.)
Would you be able to apply the associated highlight colour below whenever 3 or more numbers are matched.
1 to 9 is blue highlight
10 to 19 is orange highlight
20 to 29 is green highlight
and 30 to 40 is red highlight.
You have used purple highlight colour for power ball that is perfect
Whenever 3 numbers (upto 6 numbers maximum) and/or a powerball are matched, the match column to be populated please.I took that to mean that there were two ways to win. One if 3 or more of the first 7 balls match, and the other if the powerball matches. Should I make it so that a win occurs when 3 or more of the eight balls match? If not then please explain.
Also, in order to get the blue, orange, green, etc highlights correct I need a workbook that shows the colors you want.
- Changed Main date format to dd-mm-yy
- Changed the way wins are determined.
- Added validations for O3:V3
- Ordered C to H
- Applied colors dependent on cell value to Main columns C to J
I just noticed your "what is the other number 3 next to the draw 2138." comment. I assume you are talking about column L What is that column for?
29236406c.xlsm
ASKER

In the above snapshot , I have done some edits to look like the snapshot below.
The edits done
1. Deleted the word Match Column
2. Deleted L column
3. Added the Word Draw no. to the K column.
Edited snapshot below
 In the above snapshot all the edits done are in row 3
If you could kindly make the edits as below
1. Deletion of the word Match Column
2. Deletion of L column
3. Adding the Word Draw no. to the K column.
4. Reduction of Width of columns N:U so that it easy to view in one screen @ 100% without having to move the horizontal scroll bar back and forth.
After your edits, Row 3 snapshot would look as below .
and thus columns C:K and N:U will all stay inline.


3. I have explained the following Win Scenarios below to apply the correct highlights.
Below is Lotto Numbers plus Bonus Ball win Scenario to apply correct highlights
The rows in the draws will highlight only when the following wins occur
- Highlight colors if 3/6 numbers and bonus ball
- Highlight colors if 4/6 numbers without bonus ball
- Highlight colors if 4/6 numbers with bonus ball
- Highlight colors if 5/6 numbers without bonus ball
- Highlight colors if 5/6 numbers with bonus ball
- Highlight colors if 6 numbers without bonus ball
Below are Lotto, Bonus and Power Ball wins scenario
The rows will highlight only when the following wins occur
- Highlight colors if 3/6 numbers plus powerball
- Highlight colors if 3/6 numbers plus Bonus ball and Powerball
- Highlight colors if 4/6 numbers plus Powerball only
- Highlight colors if 4/6 numbers plus Powerball plus Bonus Ball
- Highlight colors if 5/6 numbers plus Powerball only
- Highlight colors if 5/6 numbers plus Bonus ball and Power ball
- Highlight colors if 6 numbers plus power ball only
Regarding the I column , the bonus ball column is blank
When Lotto results on the website are drawn they look as below snapshot

In the above snapshot there are 6 power ball numbers between 4 and 40
and the 7th number is a bonus ball and 8th number is power ball.
Now the bonus ball column did not populate when I typed 4 5 6 13 34 36 39 in the monitored group, the bonus ball in draw no. 2155 was 39 , instead the row looks as follows. Also no 4 got drawn but 4 did not get highlighted. Not sure what happened ?

Since the bonus ball in Column "I" is not populating, the word Bonus Ball I2 can be deleted and instead rename cell I3 to number 7. So 7 is no longer a bonus ball column and could display any number that shows up in numerical order
The numbers in columns 1 to 7 is in numerical order, therefore Bonus ball would show up in any column between 1 and 7 and that is fine.
Hence if you could kindly apply a special highlight for the Bonus ball such as the number below.
 so this special highlight would stand out from the rest of the draw numbers, while keeping the numerical order still intact or you could suggest a special highlight for the bonus ball .
29236406d.xlsm
ASKER
I have deleted the Bonus Ball column name in I2 because Bonus Ball could be any number between 1 and 40.
I mentioned this in the previous comment but you said you would rather prefer me to show you how the workbook should look and so workbook above attached. I have also named i3 to "7" and j3 to "8"
ASKER
In your workbook d, there are issues in Row 5, Row 6 and Row 12 in below snapshots
 1) Above Snapshot row 5, Two Numbers are highlighted and bonus ball plus powerball too, could you please update formula to highlight only when 3 out of 6 numbers hit and then if bonus ball and/or ball hits then it is a win.
 2) In above snapshot row 6, number 9 was not typed in N:S, yet showed a highlight, formula update required not to show 9 and there the Row 6 will not be highlighted at all.
 3) In above snapshot Row 12, power ball number 1 got highlighted, formula update required not to highlight number 1, because the typed number was 3.
 Bonus ball would now be sitting in any column between Column 1 and 7 and I am happy with that.
ASKER
For Lotto wins plus Bonus ball
The rows in the draws between C:J will highlight only when the following wins occur depending on what numbers are entered between O:V
- Highlight colors if 3/6 numbers hit without bonus ball
- Highlight colors if 3/6 numbers hit and bonus ball
- Highlight colors if 4/6 numbers hit without bonus ball
- Highlight colors if 4/6 numbers with bonus ball
- Highlight colors if 5/6 numbers without bonus ball
- Highlight colors if 5/6 numbers with bonus ball
- Highlight colors if 6 numbers without bonus ball
Below are Lotto, Bonus and Power Ball wins scenario
The rows will highlight only when the following wins occur
- Highlight colors if 3/6 numbers plus powerball
- Highlight colors if 3/6 numbers plus Bonus ball and Powerball
- Highlight colors if 4/6 numbers plus Powerball only
- Highlight colors if 4/6 numbers plus Powerball plus Bonus Ball
- Highlight colors if 5/6 numbers plus Powerball only
- Highlight colors if 5/6 numbers plus Bonus ball and Power ball
- Highlight colors if 6 numbers plus power ball only
ASKER
1) I have reduced the column width N:V so that I can view Columns A to U @ 100%, thus avoiding the need to move the horizontal bar everytime.
2) If you could please apply a special highlight to the bonus ball number only( as Bonus ball number can be any number between 1 and 40) so that I can visually see which is the bonus ball in the Columns 1 to 7 when there is a win.
The wins in March 22 were in Row 7(12Mar) and Row 12(30Mar)
Therefore in Row 7, Numbers 5 22 and 32 hit and so highlighted and your formula got correctly applied here.
In Row 12, Numbers 5 15 22 hit and a Bonus ball also was hit and so highlighted and formula got correctly applied here. Looking forward to an updated "Workbook Look" file
- Highlight colors if 3/6 numbers hit without bonus ball
- Highlight colors if 3/6 numbers hit and bonus ball
For the first one does that mean that I should compare C to H against N to S (in the new format) and if there are 3 or more matches then it's a win?
For the second one does that mean that I should compare C to H against N to S (in the new format) and if there are 2 or more matches and 'I' matches T then it's a win?
ASKER
 A. Yes you are absolutely right.
 A. No. Two numbers matching is not a win and your formula has to be tweaked to fix it, so that it will no longer highlight for 2 numbers.
ASKER
ASKER
Certificate Error below

When I clicked on the OK above, there was another error called Runtime
Runtime Error below

I have not touched any of your formulas, so not sure what happened. ?
29236406e.xlsm
ASKER
1) In Snapshot below , Row 11 (26 Mar 22) draw missed the aqua highlight on Bonus ball 35.

In Snapshot below numbers typed between O:V. Bonus ball 35 was in Column U.

2) In Snapshot below, Row 4 numbers no longer updating values from O:V, when numbers are entered in Row 3, O:V. Whatever number I type in Row 3 , row 4 does not change values, based on numbers between C:J

3) Invalid Entry Error pops up in below Snapshot when I enter numbers 3, 5, 11, 12, 19, 22, 32, 39 in cell O3.

4) My Network connection is working , however the Certificate Error and Runtime Errors are still happening and cannot update the results.
Could you kindly test out the Get Results Button at your end to check if it works for you?
The Results button runs without error for me but it is not pulling in April's data and I assume that's because we somehow need to change this link.
https://assets.mylotto.co.nz/assets/uploads/3c1f8446-b063-11ec-8d83-bf68c230783a.xlsx
ASKER
Bonus ball(1 to 40) can be in any column between C:I
Say if Bonus ball was 20 instead of 35 , then 20 is highlighted in snapshot below

That is why the request to update the table to the new format to look like the one below .
Numerical order between C:I will remain as is.

- The results in the attached workbook match yours except you have D6 and J12 highlighted and I believe those are mistakes.
- I modified the validations to make it easier to change the Monitored Numbers
29236406f.xlsm
ASKER
Two things are still not working in Summary below
2) Row 4 not updating when numbers typed in Row 3, Columns O:V
1) and 2) explained below
1) I typed draw results of 5th Mar 22
In Row 3, Columns O:V, I entered 5 6 12 18 25 27 39 8
but in below snapshot in Row 12, two numbers and bonus ball (39)
got highlighted which is not a win.
 A Win is defined as matching 3 or more of the first 6 balls against N to S
2)

[1) Two numbers and Bonus ball not a winBut in your latest Workbook-Look you show row 5 as a win. Why?
We've gone round and round on this and so I need you to once again as clearly as you can, describe what a win is. When you do please don't show the multiple rules you listed here. I'm looking for a general statement that summarizes them.
Also please attach a new Workbook-Look that illustrious the wins and highlights. And as a way to make it more accurate as far as the highlighting goes, to get the Aqua color (and you may know this already) you can copy an aqua cell from my workbook and Paste Formats in the Workbook-Look.
ASKER
 Sorry somehow I uploaded the non updated workbook look.
Workbook Look Updated.xlsx
Now I have updated Workbook Look file to look as follows and renamed the workbook file.
 Above Row 7 is a win because 3 out of 6 balls hit without a Bonus Ball
Above Row 12 is a win because 3 out of 6 balls hit with a Bonus ball 39
I have deleted Row 5 highlights as it is incorrect.
 Bonus Ball Scenario
If 3 or more of the first 6 balls match against N to S with a Bonus Ball only/ or without a Bonus Ball then it is a WIN
Power Ball only/ or Power Ball plus Bonus Ball Scenario
If 3 or more of the first 6 balls match against N to S with a Power Ball only / or Power ball plus Bonus Ball then it is a WIN.
In the attached workbook , I have created a dummy draw example between Row 18 and 27 for PowerBall Only/ or PowerBall plus Bonus Ball
In Row 19 , win refers to 3 numbers with Power Ball plus Bonus Ball
In Row 27, win refers to 3 numbers with Power Ball only.
Workbook Look Updated.xlsx
If 3 or more of the first 6 balls match against N to S with a Bonus Ball only/ or without a Bonus Ball then it is a WINFrom that it seems to me that since in all cases 3 or more of the first six balls must match for a win, that the bonus ball and the powerball have nothing to do with determining if it's a win, and so the one rule is if 3 or more of the first 6 balls match against N to S then it's a win. Is that true?
If 3 or more of the first 6 balls match against N to S with a Power Ball only / or Power ball plus Bonus Ball then it is a WIN.
I don't understand your row 9 example since none of those highlighted numbers are in the Monitored Numbers.
All this time I've assumed that the lotto number should be displayed in the Lotto column only if it's a win, but your examples don't agree with that, so please explain the rule for displaying the lotto number.
ASKER
 3 or more of the first 6 balls match against N to S is a win is true.
ASKER
 Row 9 was a dummy example as you wanted some extra examples and just for purpose of illustration
All this time I've assumed that the lotto number should be displayed in the Lotto column only if it's a win, but your examples don't agree with that, so please explain the rule for displaying the lotto number.You didn't respond to that.
ASKER

Yes the lotto number should be displayed in the lotto column only if is a win,
Any addition dummy examples including Row 9 that I have provided is just for illustration purposes as you wanted to have a better understanding.
ASKER
 Row 9 is not connected with N:S as it is a dummy example . Row 19 to 27 are also dummy examples to understand the Win Scenario and can be deleted
29236406g.xlsm
ASKER
However entering data in Row 3 , O:V keeps popping up duplicate error message , even though it is not duplicate

ASKER
Hoping to have reversible months view from March22 to Jan 22
If I click on view data button, and choose Jan 22 to Mar 22,
The draw results displayed from Jan 22 to Mar 22.
But I wanted the reverse option as well of displaying results from Mar 22 to Jan 22. But it won't let me ?
The error comes invalid date selection. Is it possible to make it display both ways ?

ASKER
Say I clicked View Data Button to search the Highlighted draw results in C:I for the last 7 years and view the highlighted results, I would do a lot of scrolling and page downs.
To avoid that, would you be able to automate this task with another new BUTTON by displaying the highlighted won draw results and hiding the rest of the non winning draws so I could see at a glance in one page.
And if you could kindly place the new Button next to the View Data Button.
Example: In Row 3, O:V , I typed 1 2 3 4 5 6 40 (bonus ball) 5(power ball).
In the attached workbook called "44results.xlsm" there were 44 highlighted draws in those 7 years. I hoped to view these 44 draws in one page and hide the non highlighted draws.
I have attached the workbook called "44results.xlsm" to view the above scenario.
44results.xlsm
And also if you could please apply the new format to Row3, A3:U3 , I have attached the workbook for that below
WorkbookLook.xlsx
ASKER
I typed "1" in O3 and O4 counted "1" as two times which is incorrect. The correct count for "1" between C:H should be 1 and not 2, but unfortunately the formula picked the "1" from Powerball and counted as 2.
The number "1" came in C10 and J12.
But J12 is a power ball number.
Formula is unable to differentiate between 1 out of 6 balls and powerball "1".
Powerball numbers are from 1 to 10.
That means your formula currently does not know the difference between Numbers 1 to 10 in C:H Column and Numbers 1 to 10 in the Power ball Column J
Not sure if formula is doing the same to bonus ball.?
29236406h.xlsm
ASKER
 Correct.
 This is not true. U4 should count the values in columns C:I
That is why the request to apply the new format urgently so as to avoid thinking that Column I is a Bonus Ball Column, but it is not.
The current format shows Column I as Bonus ball which is incorrect as Bonus ball can be any number from 1 to 40 between C:I and that is why I renamed Bonus Ball to number 7 which is in the new format in the WorkbookLook file
So Bonus Ball could be sitting in any column from 1 to 7 (C:I)
ASKER
Yes this is correct.
- Bugs fixed (hopefully)
- New format (with a couple of tweaks)
- Removed the validations
ASKER
Formula still missing the highlights.
I typed numbers in N:U in the following snapshot.

In Row 9, C:J the formula missed the highlight completely in below snapshot.

3 numbers hit out of 6 balls i.e. 20, 30, 40 and Powerball 9 hit.
This was a win, Row 9 draw was 19 Mar 22.
The numbers that missed the highlight was 20, 30, 40 and powerball 9
ASKER

15 5 22 12 19 32 39 and powerball 5 were the numbers typed in below snapshot

ASKER
I clicked on the Get Latest Results button and the snapshot below said results are upto date

But when I checked the Winning Number Results Sheet, the April Results did not get updated and still showed results upto 30March 22 as below

Not Sure what happened there.
Time Period
Also when I tried to select the time period below, there was no April 22 option, but only upto March 22

3 numbers hit out of 6 balls i.e. 20, 30, 40 and Powerball 9 hit.You told me that a win requires 3 out of the first six balls to match; 40 is ball 7.
I clicked on the Get Latest Results button and the snapshot below said results are upto dateI mentioned above that we are still using this link to get the data.
https://assets.mylotto.co.nz/assets/uploads/3c1f8446-b063-11ec-8d83-bf68c230783a.xlsx
Shouldn't we be using a different link?
ASKER
3 balls out of 7 balls is not a win. 3 out of 6 balls is a win (between 1 and 40).
If the 3 balls are three of the first six drawn out then it is a bonus ticket( a win without cash).
Winning tickets means cash is paid out
If you get the bonus ball as well along with the 3 balls, then it is a winning ticket, If you get the powerball and three of those first six balls then it is a winning ticket.
The 7th ball is the bonus ball. If you get two of the first six numbers drawn and the bonus ball that is NOT a win.
That is 3 balls out of 7 but NOT a win
ASKER
3 numbers hit out of 6 balls i.e. 20, 30, 40 and Powerball 9 hit.So I can forget about that problem, correct?
Powerball 5 in below snapshot missed the highlight in Row 7 (12 Mar 22 draw)
- If 5 is in columns C to H is it colored to match the powerball column header?
- If 5 is in columns I (column 7) is it colored to match the powerball column header?
- If 5 is in columns J is it colored to match the powerball column header?
ASKER
 In the above snapshot , 20, 30 and 40 numbers hit out of 6 balls and along with that Powerball 9 also hit.
So when I typed the numbers between N:U , the highlight should fall on 20, 30 and 40 and Powerball number 9,

ASKER
 I am not sure if I understood this question correctly. ?
In below snapshot number 5 is in Column C and as per colour guidelines that you had adopted below
Numbers 1 to 9 is blue highlight, So Number 5 in Column C got a wrong highlight. the highlight colour should have been BLUE color, the Power ball highlight missed the pink colour highlight.
I think if you tweak the formula to apply the correct highlight to the number group it should be ok

Highlight Colour Guidelines
9 is blue highlight
10 to 19 is orange highlight
20 to 29 is green highlight
and 30 to 40 is red highlight.
Bonus ball is Aqua Highlight
ASKER

5 - blue - correct highlight colour
22 - green - correct highlight
32 - red - correct highlight
9 - pink - missed highlight colur
ASKER
Following are the Rows that have missed highlights
Row 7 - highlight missed completely
Typed numbers in N:U below snapshot

Highlights missed in below snapshot are 5, 22, 34, Bonus ball 32 and Power Ball 5

Row 8 - Highlights missed completely
Typed numbers in N:U below snapshot

Highlights missed in below snapshot are 4, 24, 35 & Bonus ball 22.

Row 9 - Highlights missed completely
Typed numbers in N:U below snapshot

Highlights missed in below snapshot are 20 30 40 & Bonus ball 9 (C9) and Power ball 9.

Row 8: You said "It is a Win only when there are 3 or more matches , when C:H is compared against N:S". so since only 2 balls (4 and 24) out of the first six match N to S it's not a win.
Row 9: Same situation. Only 20 and 30 out of the first six match N to S it's not a win.
ASKER
Row 7: You said "The 7th ball is the bonus ball. If you get two of the first six numbers drawn and the bonus ball that is NOT a win", so since only 2 balls (5 and 22) out of the first six match it's mot a win.7th ball is a bonus ball is correct. But the Bonus ball in below picture is 32

In the above snapshot Three of the 6 balls matched. 5, 22 and 34
and as you can see above the 7th Ball was number 32 and also Power ball number 5 hit.
ASKER
Row 8: You said "It is a Win only when there are 3 or more matches , when C:H is compared against N:S". so since only 2 balls (4 and 24) out of the first six match N to S it's not a win.
It is a Win only when there are 3 or matches is correct, but 35 also matched as below along with Bonus Ball 22.

And in the above draw Snapshot you can clearly see 4,24 and 35 matched against N:S.
Balls 4, 24 and 35 matched out of 6 balls and the Bonus ball 22 was the 7th ball.
So the highlight will be on 4, 24 and 35 and Bonus ball 22 will also be highlighted.
ASKER
Row 9: Same situation. Only 20 and 30 out of the first six match N to S it's not a win.
In below snapshot , 3 numbers 20,30 , 40 matched against N:S and also Bonus ball 9 and Power ball 9 matched too.

So the highlights for Row 9 would look as below

In the excel table Row 9,
Cell C9 is the bonus ball which is number 9 and should get aqua highlight as above .
Bonus ball can be located anywhere between C:H and in this case the bonus ball 9 was sitting in Cell C9
Cell E9,G9 and I9 are 20, 30 and 40 which are 3 matches out of 6 balls.
While J9 is the power ball number 9 which should get Pink colour highlight as above
- Two balls matching in C to H and the bonus ball
- Two balls matching in C to H and the power ball
ASKER
Tow balls matching C to H and the power ball is not a win.
ASKER
Row 8 : 4, 24 and 35 matched out of 6 balls
Row 9 : 20, 30 and 40 matched out of 6 balls
I believe that for any given row if my code finds 3 values in columns C to H that match what is in N4 to S4 then it will be found to be a match. If you disagree please update row 7 and N4 to S4 to create an example that proves me wrong and provide the workbook.
ASKER
I believe that for any given row if my code finds 3 values in columns C to H that match what is in N4 to S4 then it will be found to be a match
yes this is correct
ASKER

Below is what the highlight should look like for Row 7

Highlights for 5, 22 and 34 are 3 matches out of 6 balls,
Highlight for Bonus ball 32 is aqua
Highlight for Power Ball is pink highlight
ASKER
Then what is wrong?
Row 7 matched numbers missed the highlight
and so below is the highlight for that
ASKER
15 5 22 34 19 33 Bonus 32 and Power Ball 5
And see if Row 7 is highlighting is appreciated
22 is a match with N to S
23 is a NOT match with N to S
26 is a NOT match with N to S
28 is a NOT match with N to S
32 is a NOT match with N to S
So since only two of the first 6 balls in C to H match what's in N to S it isn't a match.
ASKER
ASKER
ASKER
ASKER
ASKER
3 balls out of 7 balls is not a win. 3 out of 6 balls is a win (between 1 and 40).
ASKER
If you get two of the first six numbers drawn and the bonus ball that is NOT A WIN.
Though that is 3 out of 7 balls but it is not a WIN
2/6 hit and a bonus ball hit . That totals to 3 out of 7
And 2 (out of 6)+ 1(bonus ball) = 3 out of 7 and so not a WIN
Minimum requirement to win 3 of 6 balls
ASKER
3 balls out of 7 balls is not a win. 3 out of 6 balls is a win (between 1 and 40).
Yes. And the 6 balls can be anywhere between C:I
And for Row 7 example ,
Ball number 34 was sitting in the I Column.(7th Column)
And therefore 5, 22 and 34 matched N:S
ASKER
Bonus ball is 32.
Power Ball is 5.
ASKER
and it could be that the formula does not look at Column I at all.
and that could be the reason why it missed 34 in Column I and therefore did not highlight that row.
A tweak in the formula would fix it, so that N:S compares against C:I (1 to 7) to look for minimum 3 balls between 1 and 40 for a win and a row highlight
29236406j.xlsm
ASKER
ASKER

Above is 9 Mar 22 draw at Row 6,
But the Snapshot below in Row 6 has highlight issue.

9March 22 draw - 3 winning numbers were 5, 16 and 39
However 39 got an Aqua highlight instead of Red
So if I typed 39 in P4 and 39 in T4, the formula looks at 39 as a bonus ball only, it does not look at 39 as being part of the 3 winning numbers.
So does that mean validation is required for N:U so that the formula can differentiate between a winning number 39 or bonus ball number 39?