How to change number format on bar plot in R?
I'm new to R and need assistance in formatting the numbers on a bar plot. My source file is a csv and the column on which I'm doing calculations is formatted without commas as I'm told that is necessary to avoid problems. I want to add a $ sign and commas (currency format) to the data labels on the first graph and show the $ sign and only two decimal places on the second graph. Similar changes are then needed on the Y axis for both graphs.
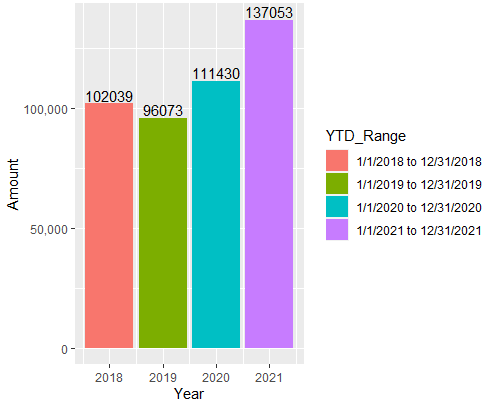
Code for first graph:
ggplot(xmasTotals_df, aes(x = Year, y = Amount, fill = YTD_Range)) +
geom_bar(stat="identity", position=position_dodge()) +
geom_col() +
geom_text(aes(label = Amount), vjust = -0.2) +
scale_y_continuous(labels = comma)
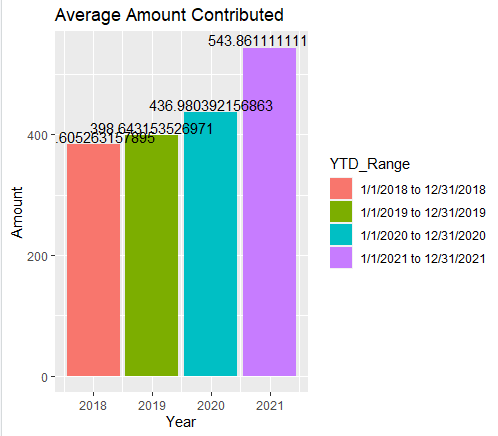
 Code for second graph:
ggplot(xmasTotals_df, aes(x = Year, y = Amount, fill = YTD_Range)) +
geom_bar(stat="identity", position=position_dodge()) +
geom_col() +
geom_text(aes(label = Amount), vjust = -0.2) +
labs(title = "Average Amount Contributed")
 Any suggestions would be appreciated.
ASKER
Many thanks for your suggestion! It was easy to implement and will be used countless times going forward.
Bryan