Power BI
--
Questions
--
Followers
Top Experts
Hi, I am having issues to align data in a visual on PowerBi, The highlighted numbers are 1 customer but is been duplicated as the data is not aligned. How can I avoid duplicates if is the same data?
Is there a way to see the milestones in one single line instead of one milestone per row? 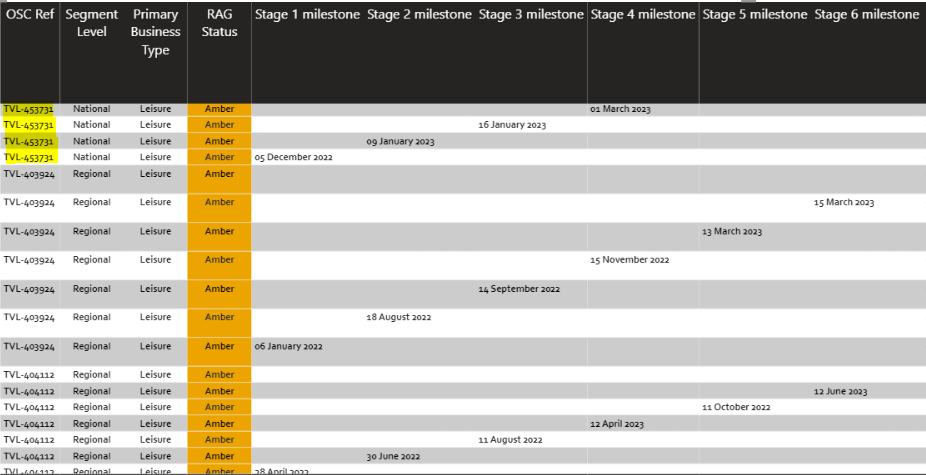
Zero AI Policy
We believe in human intelligence. Our moderation policy strictly prohibits the use of LLM content in our Q&A threads.
..Is there a way to see the milestones in one single line instead of one milestone per row?
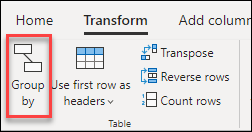
You can use group by aggregator function to filtered out the result instead.
More information:
Thanks so much for answering. I don't need one single value I need them all in one row (aligned) as the dates are stages of projects. Let me know if you know how to do this please thanks so much
You just need to group your existing 4 fields below:
...GroupBy OSC Ref, Segment Level, Primary Business Type, RAG Status


EARN REWARDS FOR ASKING, ANSWERING, AND MORE.
Earn free swag for participating on the platform.
Power BI
--
Questions
--
Followers
Top Experts
Power BI is a business analytics tool from Microsoft used for data visualization. It integrates seamlessly with other tools, like Microsoft Excel, and is easily embedded in websites and apps. Power BI offers live dashboards and visual reports to help “bring your data to life.” There are many opportunities for customization, as well as built-in options for your visualizations and analytics. With the Power BI mobile app, you can receive push notifications about important data changes, allowing you to react and plan right away.