4:20
Advanced tutorial on how to run the esxtop command to capture a batch file in csv format in order to export the file and use it for performance analysis. He demonstrates how to download the file using a vSphere web client (or vSphere client) and export to a Windows VM where you can use perfmon to review the data, in this tutorial Brian focuses on the memory metrics. He demonstrates the report option that gives you the values in an easy to read format.
Video Steps
1. Enable SSH on ESXi host and use putty to connect to it
Login using your root username and password2. Run esxtop in batch mode
The command is as follows:esxtop -b -d 2 -n 60 > esxoutput.csvEnter will run the command and it will take 2 minutes to complete based on our iteration settings.
3. Confirm the output file was created
The following command will verify we have a valid file with data in it:ls -l esxout*4. Export the output off of ESXi host
You can use WinSCP or other utilities.In our case, we will copy it to a VMFS datastore by using the following command:
cp esxoutput.csv /[your_volume_location/]5. Open vSphere Web Client and download the esxtop output file from the VMFS datastore
Select the "Storage" menu, then the NFS datastore, and then right-click the esx file and choose "Download from Datastore".At the Client Integration Access Control window, select the "allow" option.
Save the file to your preferred location and you may watch the progress of the download in the lower portion of the window.
6. Open the Windows perfmon utility and select the esxtop data
Right-click "Performance Monitor" in the left hand pane of the perfmon utility, and choose "Properties".Select the "Source" tab and for data source select "Log Files" and select the "Add" button.
Select the esxoutput file from its location. You may specify a time range to analyze here if you'd like.
Click Apply.
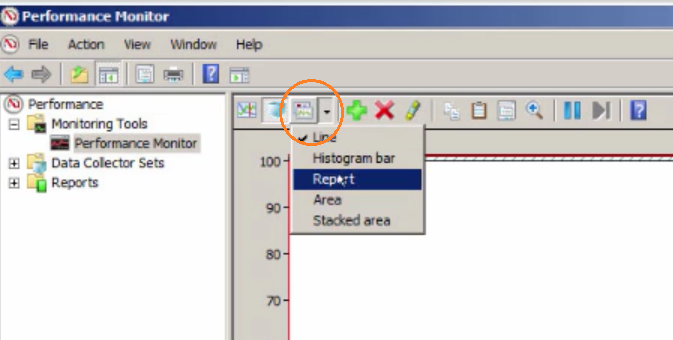
7. Add counters to view the available data
There are many interesting counters to choose from including: Group CPU, Group Memory, Interrupt Vector, Memory, Physical CPU, etc.We will focus on all of the memory counters and select OK.
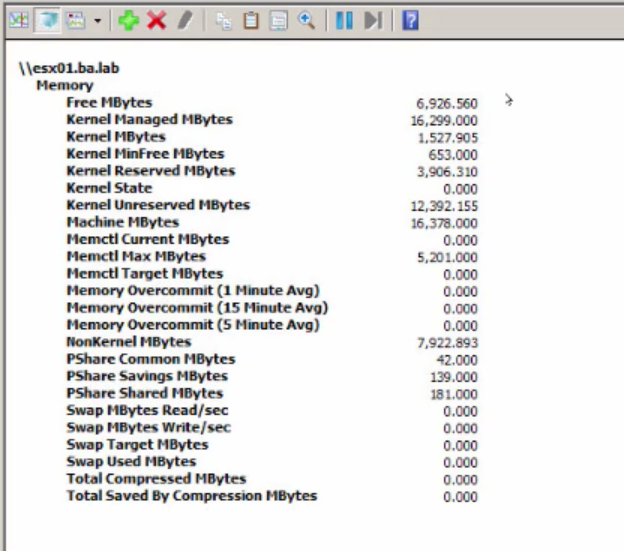
8. Review the counter data
You can choose individual counters and view the values in the chart:
or use the report option which shows all values:
0 Comments
Suggested Videos

Looking to migrate your existing VMware environment to VMware Cloud Foundation? Below is a brief summary of what is involved in making this transition based on my personal experience.
Microsoft has ended support for Windows Server 2012R2. This means not only an end to features and bug fixes, but an end to security patches as well. Rather than building a new server from scratch, there is the option for an in-place upgrade.